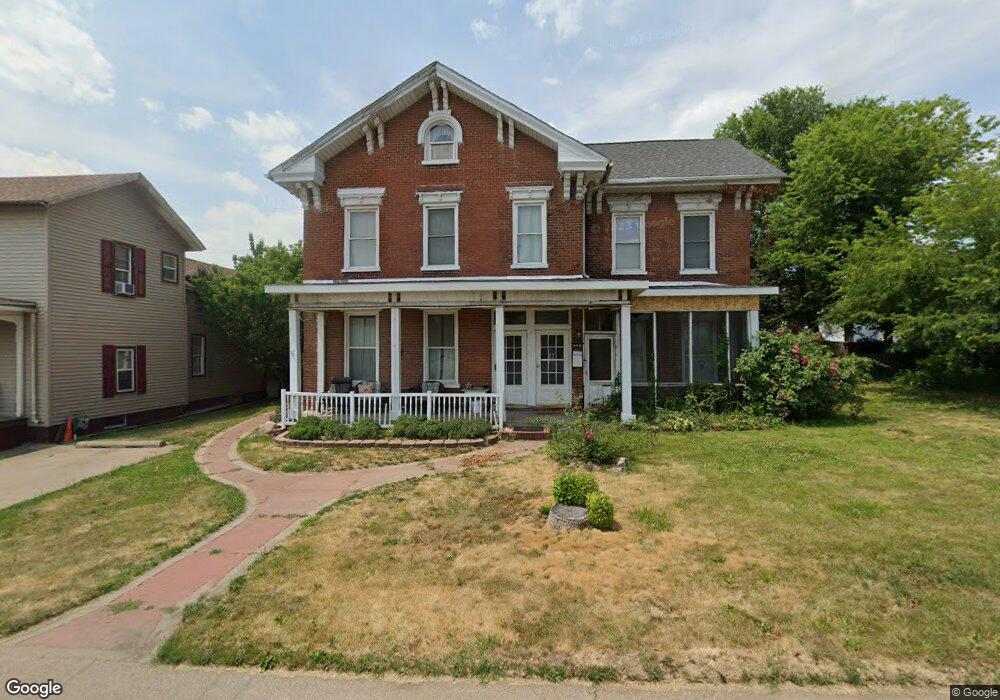
409 E 5th St Muscatine, IA 52761
Estimated Value: $173,395 - $185,000
7
Beds
3
Baths
3,506
Sq Ft
$51/Sq Ft
Est. Value
About This Home
This home is located at 409 E 5th St, Muscatine, IA 52761 and is currently estimated at $180,099, approximately $51 per square foot. 409 E 5th St is a home located in Muscatine County with nearby schools including Muskie Early Learning Center, Jefferson Elementary School, and Susan Clark Junior High School.
Ownership History
Date
Name
Owned For
Owner Type
Purchase Details
Closed on
Sep 19, 2011
Sold by
Brooks Paul L and Brooks Carolyn S
Bought by
Linderman Brian J and Linderman Cheryl E
Current Estimated Value
Home Financials for this Owner
Home Financials are based on the most recent Mortgage that was taken out on this home.
Original Mortgage
$82,000
Outstanding Balance
$55,830
Interest Rate
4.14%
Mortgage Type
Future Advance Clause Open End Mortgage
Estimated Equity
$124,269
Create a Home Valuation Report for This Property
The Home Valuation Report is an in-depth analysis detailing your home's value as well as a comparison with similar homes in the area
Home Values in the Area
Average Home Value in this Area
Purchase History
| Date | Buyer | Sale Price | Title Company |
|---|---|---|---|
| Linderman Brian J | $36,000 | None Available |
Source: Public Records
Mortgage History
| Date | Status | Borrower | Loan Amount |
|---|---|---|---|
| Open | Linderman Brian J | $82,000 |
Source: Public Records
Tax History
| Year | Tax Paid | Tax Assessment Tax Assessment Total Assessment is a certain percentage of the fair market value that is determined by local assessors to be the total taxable value of land and additions on the property. | Land | Improvement |
|---|---|---|---|---|
| 2025 | $2,514 | $149,470 | $24,970 | $124,500 |
| 2024 | $2,514 | $148,940 | $24,970 | $123,970 |
| 2023 | $2,458 | $151,633 | $24,921 | $126,712 |
| 2022 | $2,892 | $116,390 | $23,510 | $92,880 |
| 2021 | $1,812 | $97,800 | $23,510 | $74,290 |
| 2020 | $2,168 | $111,940 | $20,090 | $91,850 |
| 2019 | $2,154 | $105,990 | $0 | $0 |
| 2018 | $2,120 | $105,990 | $0 | $0 |
| 2017 | $2,120 | $112,590 | $0 | $0 |
| 2016 | $2,348 | $112,590 | $0 | $0 |
| 2015 | $2,348 | $101,800 | $0 | $0 |
| 2014 | $2,120 | $101,800 | $0 | $0 |
Source: Public Records
Map
Nearby Homes
Your Personal Tour Guide
Ask me questions while you tour the home.