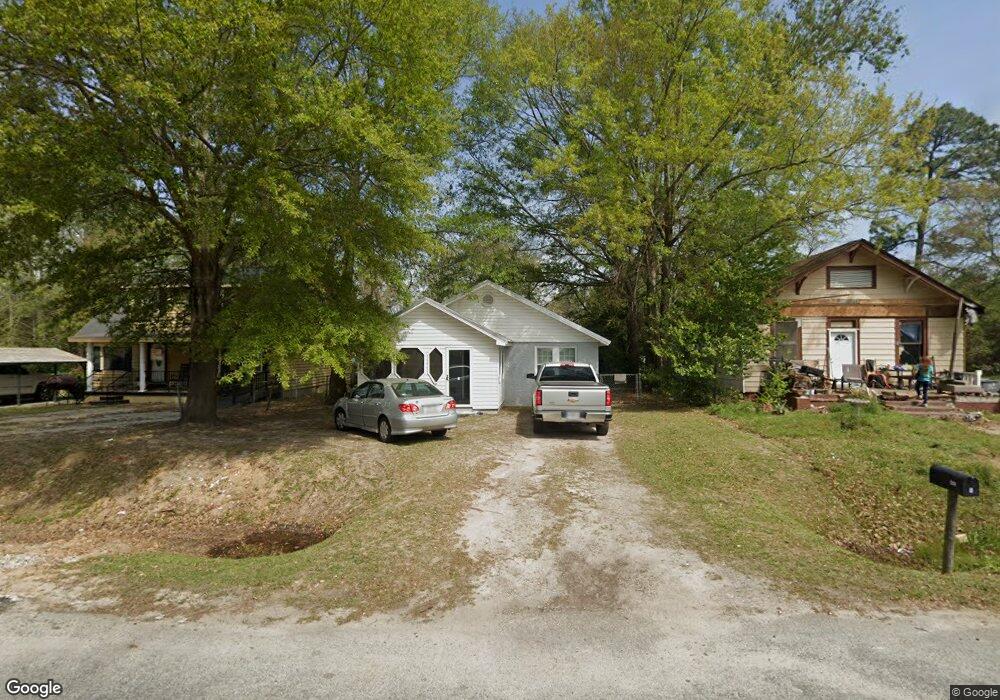
409 E 7th Ave Cordele, GA 31015
Estimated Value: $59,473 - $84,000
2
Beds
1
Bath
784
Sq Ft
$85/Sq Ft
Est. Value
About This Home
This home is located at 409 E 7th Ave, Cordele, GA 31015 and is currently estimated at $66,868, approximately $85 per square foot. 409 E 7th Ave is a home located in Crisp County with nearby schools including Crisp County Elementary School, Crisp County Primary School, and Crisp County Middle School.
Ownership History
Date
Name
Owned For
Owner Type
Purchase Details
Closed on
Oct 20, 2015
Sold by
Nipper Brian
Bought by
Hill Jerry
Current Estimated Value
Home Financials for this Owner
Home Financials are based on the most recent Mortgage that was taken out on this home.
Original Mortgage
$24,000
Interest Rate
3.89%
Mortgage Type
New Conventional
Purchase Details
Closed on
Feb 3, 2009
Sold by
Adkins Cricket
Bought by
Nipper Brian Eric
Purchase Details
Closed on
Mar 10, 1989
Bought by
Nipper Bobby E
Create a Home Valuation Report for This Property
The Home Valuation Report is an in-depth analysis detailing your home's value as well as a comparison with similar homes in the area
Purchase History
| Date | Buyer | Sale Price | Title Company |
|---|---|---|---|
| Hill Jerry | $26,500 | -- | |
| Nipper Brian Eric | $1,950 | -- | |
| Nipper Bobby E | $16,000 | -- |
Source: Public Records
Mortgage History
| Date | Status | Borrower | Loan Amount |
|---|---|---|---|
| Closed | Hill Jerry | $24,000 |
Source: Public Records
Tax History
| Year | Tax Paid | Tax Assessment Tax Assessment Total Assessment is a certain percentage of the fair market value that is determined by local assessors to be the total taxable value of land and additions on the property. | Land | Improvement |
|---|---|---|---|---|
| 2025 | $736 | $20,866 | $1,000 | $19,866 |
| 2024 | $676 | $18,854 | $1,000 | $17,854 |
| 2023 | $669 | $17,847 | $1,000 | $16,847 |
| 2022 | $445 | $16,840 | $1,000 | $15,840 |
| 2021 | $436 | $15,833 | $1,000 | $14,833 |
| 2020 | $446 | $15,833 | $1,000 | $14,833 |
| 2019 | $449 | $15,833 | $1,000 | $14,833 |
| 2018 | $289 | $9,812 | $1,200 | $8,612 |
| 2017 | $398 | $9,812 | $1,200 | $8,612 |
| 2016 | $290 | $9,812 | $1,200 | $8,612 |
| 2015 | -- | $9,812 | $1,200 | $8,612 |
| 2014 | -- | $9,812 | $1,200 | $8,612 |
| 2013 | -- | $3,257 | $1,200 | $2,057 |
Source: Public Records
Map
Nearby Homes
Your Personal Tour Guide
Ask me questions while you tour the home.