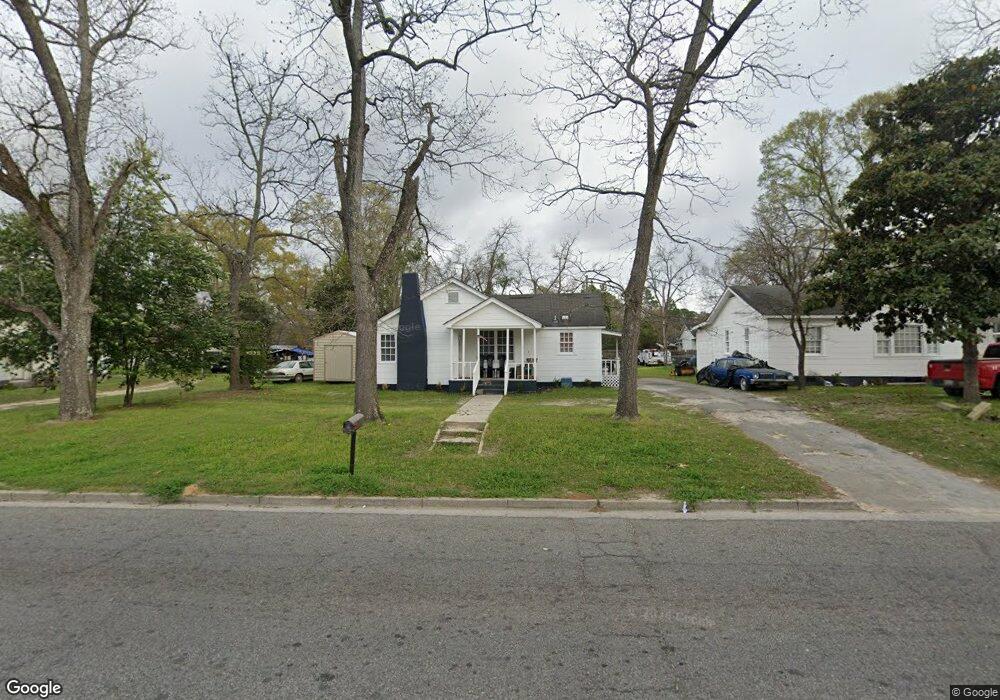
409 E 8th Ave Cordele, GA 31015
Estimated Value: $64,000 - $101,000
2
Beds
1
Bath
1,129
Sq Ft
$68/Sq Ft
Est. Value
About This Home
This home is located at 409 E 8th Ave, Cordele, GA 31015 and is currently estimated at $76,220, approximately $67 per square foot. 409 E 8th Ave is a home located in Crisp County with nearby schools including Crisp County Elementary School, Crisp County Primary School, and Crisp County Middle School.
Ownership History
Date
Name
Owned For
Owner Type
Purchase Details
Closed on
Sep 23, 2025
Sold by
Brushy Creek Enterprises Llc
Bought by
Fields Sacha R and Green Lisa F
Current Estimated Value
Purchase Details
Closed on
Feb 4, 2025
Sold by
Green Lisa F
Bought by
Brushy Creek Enterprises Llc and Cmmp Properties Llc
Purchase Details
Closed on
Sep 9, 2022
Sold by
Fields Sacha
Bought by
Green Lisa F
Purchase Details
Closed on
Mar 7, 2022
Sold by
Sheppard And Son Properties Llc
Bought by
Fields Sacha
Purchase Details
Closed on
Jun 12, 2021
Sold by
Johnson Dwight L
Bought by
Fields Sacha R
Purchase Details
Closed on
Dec 5, 2017
Sold by
Lofton
Bought by
Johnson Dwight L
Purchase Details
Closed on
Nov 10, 2014
Sold by
Rice Molly S Aif
Bought by
Sheppard And Son Properties Llc
Purchase Details
Closed on
Jan 2, 2007
Sold by
Gamble Carolyn M
Bought by
Sheppard G Wylie
Purchase Details
Closed on
Sep 14, 1998
Sold by
Sheppard G Wylie
Bought by
Gamble Carolyn M
Purchase Details
Closed on
Aug 17, 1998
Sold by
Fowler Ronald Sr +
Bought by
Sheppard G Wylie
Purchase Details
Closed on
Aug 23, 1991
Sold by
Moore Jean D
Bought by
Fowler Ronald Sr +
Purchase Details
Closed on
Apr 23, 1976
Bought by
Moore Jean D
Create a Home Valuation Report for This Property
The Home Valuation Report is an in-depth analysis detailing your home's value as well as a comparison with similar homes in the area
Purchase History
| Date | Buyer | Sale Price | Title Company |
|---|---|---|---|
| Fields Sacha R | -- | -- | |
| Brushy Creek Enterprises Llc | -- | -- | |
| Green Lisa F | $20,000 | -- | |
| Fields Sacha | $15,000 | -- | |
| Fields Sacha R | -- | -- | |
| Johnson Dwight L | $1,333 | -- | |
| Sheppard And Son Properties Llc | -- | -- | |
| Sheppard G Wylie | $29,878 | -- | |
| Gamble Carolyn M | $37,600 | -- | |
| Sheppard G Wylie | $35,000 | -- | |
| Fowler Ronald Sr + | $27,100 | -- | |
| Moore Jean D | -- | -- |
Source: Public Records
Tax History
| Year | Tax Paid | Tax Assessment Tax Assessment Total Assessment is a certain percentage of the fair market value that is determined by local assessors to be the total taxable value of land and additions on the property. | Land | Improvement |
|---|---|---|---|---|
| 2025 | $569 | $16,127 | $1,640 | $14,487 |
| 2024 | $530 | $14,800 | $1,640 | $13,160 |
| 2023 | $135 | $14,136 | $1,640 | $12,496 |
| 2022 | $356 | $13,473 | $1,640 | $11,833 |
| 2021 | $349 | $12,809 | $1,640 | $11,169 |
| 2020 | $361 | $12,809 | $1,640 | $11,169 |
| 2019 | $363 | $12,809 | $1,640 | $11,169 |
| 2018 | $399 | $13,550 | $1,968 | $11,582 |
| 2017 | $550 | $13,550 | $1,968 | $11,582 |
| 2016 | $401 | $13,550 | $1,968 | $11,582 |
| 2015 | -- | $13,550 | $1,968 | $11,582 |
| 2014 | -- | $13,550 | $1,968 | $11,582 |
| 2013 | -- | $13,549 | $1,968 | $11,581 |
Source: Public Records
Map
Nearby Homes
Your Personal Tour Guide
Ask me questions while you tour the home.