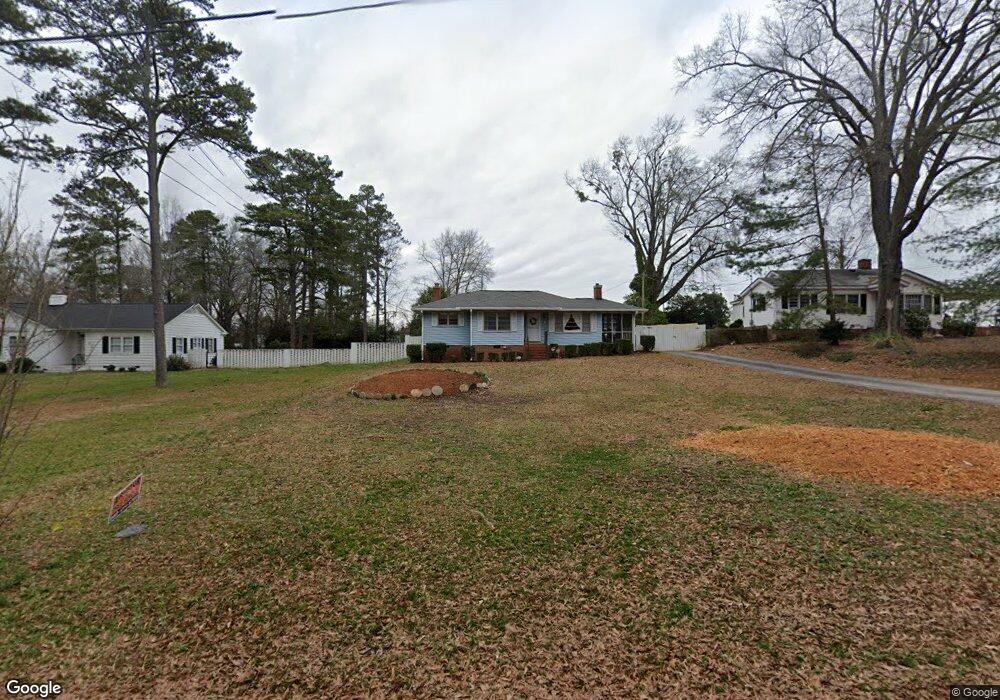
409 E Church St Unit 3 Elberton, GA 30635
Estimated Value: $186,000 - $229,000
3
Beds
2
Baths
1,705
Sq Ft
$118/Sq Ft
Est. Value
About This Home
This home is located at 409 E Church St Unit 3, Elberton, GA 30635 and is currently estimated at $201,627, approximately $118 per square foot. 409 E Church St Unit 3 is a home located in Elbert County with nearby schools including Elbert County Primary School, Elbert County Elementary School, and Elbert County Middle School.
Ownership History
Date
Name
Owned For
Owner Type
Purchase Details
Closed on
Dec 31, 2020
Sold by
Hadaway Juanita S
Bought by
Moyers Dwayne S and Moyers Deborah L
Current Estimated Value
Home Financials for this Owner
Home Financials are based on the most recent Mortgage that was taken out on this home.
Original Mortgage
$100,800
Outstanding Balance
$80,618
Interest Rate
2.71%
Mortgage Type
New Conventional
Estimated Equity
$121,009
Purchase Details
Closed on
May 25, 2012
Sold by
Christian V Deborah
Bought by
Hadaway Juanita S and Hadaway Robert N
Home Financials for this Owner
Home Financials are based on the most recent Mortgage that was taken out on this home.
Original Mortgage
$82,845
Interest Rate
3.87%
Mortgage Type
FHA
Purchase Details
Closed on
Nov 1, 1976
Purchase Details
Closed on
Apr 1, 1958
Create a Home Valuation Report for This Property
The Home Valuation Report is an in-depth analysis detailing your home's value as well as a comparison with similar homes in the area
Home Values in the Area
Average Home Value in this Area
Purchase History
| Date | Buyer | Sale Price | Title Company |
|---|---|---|---|
| Moyers Dwayne S | $126,000 | -- | |
| Hadaway Juanita S | $85,000 | -- | |
| -- | -- | -- | |
| -- | -- | -- |
Source: Public Records
Mortgage History
| Date | Status | Borrower | Loan Amount |
|---|---|---|---|
| Open | Moyers Dwayne S | $100,800 | |
| Previous Owner | Hadaway Juanita S | $82,845 |
Source: Public Records
Tax History Compared to Growth
Tax History
| Year | Tax Paid | Tax Assessment Tax Assessment Total Assessment is a certain percentage of the fair market value that is determined by local assessors to be the total taxable value of land and additions on the property. | Land | Improvement |
|---|---|---|---|---|
| 2024 | $1,555 | $68,636 | $5,952 | $62,684 |
| 2023 | $1,555 | $68,636 | $5,952 | $62,684 |
| 2022 | $1,060 | $48,459 | $5,952 | $42,507 |
| 2021 | $1,067 | $48,459 | $5,952 | $42,507 |
| 2020 | $737 | $36,726 | $5,952 | $30,774 |
| 2019 | $889 | $36,726 | $5,952 | $30,774 |
| 2018 | $905 | $36,726 | $5,952 | $30,774 |
| 2017 | $892 | $34,093 | $5,952 | $28,141 |
| 2016 | $842 | $34,093 | $5,952 | $28,141 |
| 2015 | -- | $34,093 | $5,952 | $28,141 |
| 2014 | -- | $34,093 | $5,952 | $28,141 |
| 2013 | -- | $34,093 | $5,952 | $28,141 |
Source: Public Records
Map
Nearby Homes
- 122 Parkwood Dr
- 135 Brookside Dr
- 211 Snyder Ave
- 173 Brookside Dr
- 214 Campbell St
- 181 Brookside Dr
- 0 Old Middleton Rd Unit 22775401
- 0 Old Middleton Rd Unit 10651016
- 349 Cook St
- 120 S Tusten St
- 252 Edwards St
- 245 Edwards St
- 141 Wildwood Dr
- 115 S Thomas St
- 105 S Thomas St
- 844 Sherwood Dr
- 968 Ext Elbert St
- 2790 Cedar Creek Rd
- 196 S Oliver St
- 44 Clairmont Ave
- 409 E Church St
- 411 E Church St
- 407 E Church St
- 110 Hayes St
- 108 Hayes St
- 414 E Church St
- 418 E Church St
- 106 Hayes St
- 117 Parkwood Dr
- 419 E Church St
- 405 E Church St
- 410 E Church St
- 113 Parkwood Dr
- 408 E Church St
- 0 Parkwood Dr
- 145 Parkwood Dr
- 7 Parkwood Dr
- 118 Parkwood Dr
- 397 E Church St
- 425 E Church St