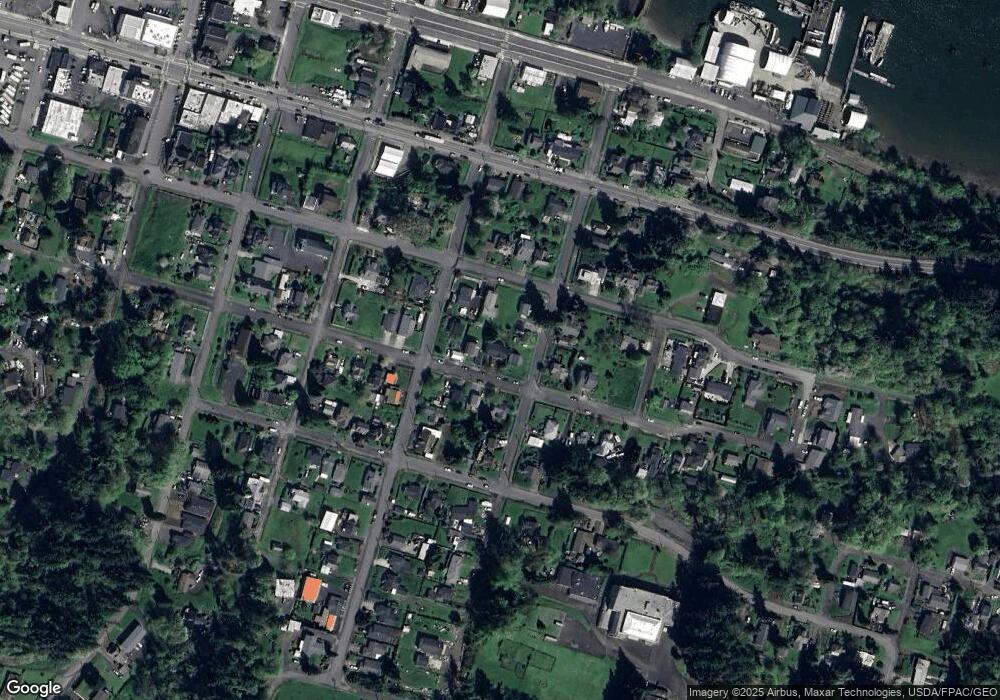
409 E D St Rainier, OR 97048
Estimated Value: $380,347 - $456,000
5
Beds
2
Baths
2,200
Sq Ft
$194/Sq Ft
Est. Value
About This Home
This home is located at 409 E D St, Rainier, OR 97048 and is currently estimated at $427,837, approximately $194 per square foot. 409 E D St is a home located in Columbia County with nearby schools including Hudson Park Elementary School, Rainier Junior/Senior High School, and North Columbia Academy.
Ownership History
Date
Name
Owned For
Owner Type
Purchase Details
Closed on
Aug 31, 2015
Sold by
Coffman Douglas A
Bought by
Jefferson Jamen C and Jefferson Sarah
Current Estimated Value
Home Financials for this Owner
Home Financials are based on the most recent Mortgage that was taken out on this home.
Original Mortgage
$162,244
Outstanding Balance
$127,342
Interest Rate
4.05%
Mortgage Type
New Conventional
Estimated Equity
$300,495
Purchase Details
Closed on
Mar 15, 2006
Sold by
Laursen James N
Bought by
Coffman Douglas A
Create a Home Valuation Report for This Property
The Home Valuation Report is an in-depth analysis detailing your home's value as well as a comparison with similar homes in the area
Purchase History
| Date | Buyer | Sale Price | Title Company |
|---|---|---|---|
| Jefferson Jamen C | $159,000 | Ticor Title | |
| Coffman Douglas A | $155,000 | Ticor Title |
Source: Public Records
Mortgage History
| Date | Status | Borrower | Loan Amount |
|---|---|---|---|
| Open | Jefferson Jamen C | $162,244 |
Source: Public Records
Tax History
| Year | Tax Paid | Tax Assessment Tax Assessment Total Assessment is a certain percentage of the fair market value that is determined by local assessors to be the total taxable value of land and additions on the property. | Land | Improvement |
|---|---|---|---|---|
| 2025 | $3,742 | $202,600 | $32,490 | $170,110 |
| 2024 | $3,655 | $196,700 | $31,540 | $165,160 |
| 2023 | $3,604 | $190,980 | $29,740 | $161,240 |
| 2022 | $3,442 | $185,420 | $28,860 | $156,560 |
| 2021 | $3,385 | $180,020 | $31,860 | $148,160 |
| 2020 | $3,290 | $174,780 | $29,910 | $144,870 |
| 2019 | $3,238 | $169,690 | $35,870 | $133,820 |
| 2018 | $3,163 | $164,750 | $48,720 | $116,030 |
| 2017 | $3,133 | $159,960 | $47,300 | $112,660 |
| 2016 | $3,044 | $155,310 | $45,920 | $109,390 |
| 2015 | $2,808 | $150,790 | $36,880 | $113,910 |
| 2014 | $2,821 | $146,400 | $39,610 | $106,790 |
Source: Public Records
Map
Nearby Homes
Your Personal Tour Guide
Ask me questions while you tour the home.