Estimated Value: $84,498 - $184,000
3
Beds
2
Baths
1,852
Sq Ft
$60/Sq Ft
Est. Value
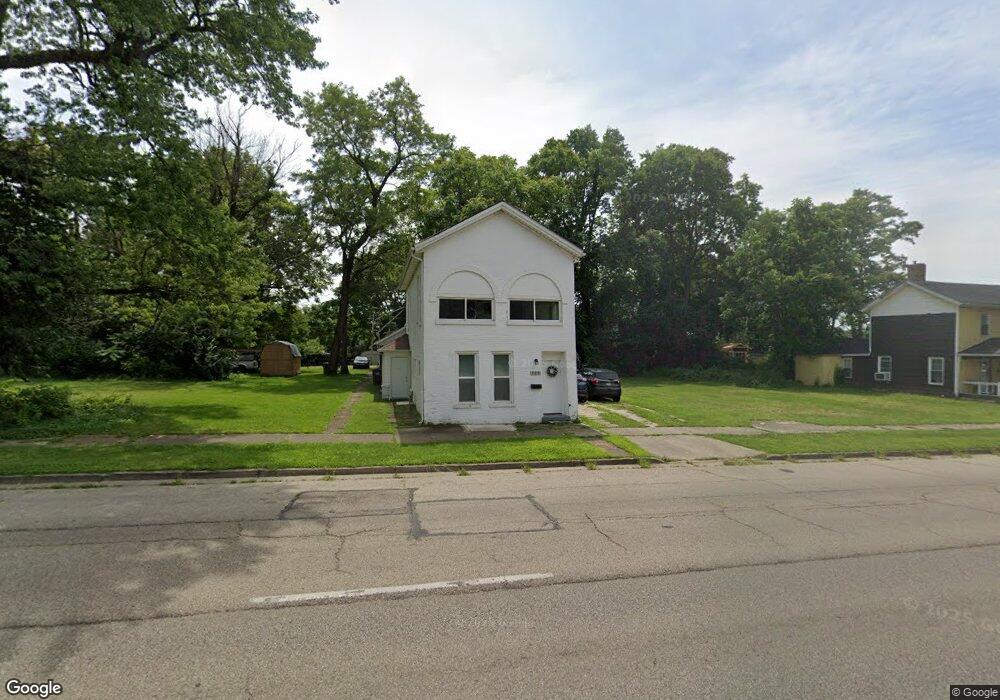
About This Home
This home is located at 409 E Main St, Xenia, OH 45385 and is currently estimated at $111,875, approximately $60 per square foot. 409 E Main St is a home located in Greene County with nearby schools including Xenia High School, Summit Academy Community School for Alternative Learners - Xenia, and Legacy Christian Academy.
Ownership History
Date
Name
Owned For
Owner Type
Purchase Details
Closed on
Mar 18, 2021
Sold by
Mi South Properties Llc
Bought by
Chuckwagon Properties Llc
Current Estimated Value
Purchase Details
Closed on
Feb 12, 2021
Sold by
Kelly Tony B
Bought by
Mi South Properties Llc
Purchase Details
Closed on
Nov 2, 2000
Sold by
Geist Robert A
Bought by
Kelley Betty
Create a Home Valuation Report for This Property
The Home Valuation Report is an in-depth analysis detailing your home's value as well as a comparison with similar homes in the area
Home Values in the Area
Average Home Value in this Area
Purchase History
| Date | Buyer | Sale Price | Title Company |
|---|---|---|---|
| Chuckwagon Properties Llc | -- | None Listed On Document | |
| Mi South Properties Llc | $1,000 | None Available | |
| Kelley Betty | $10,200 | -- |
Source: Public Records
Tax History
| Year | Tax Paid | Tax Assessment Tax Assessment Total Assessment is a certain percentage of the fair market value that is determined by local assessors to be the total taxable value of land and additions on the property. | Land | Improvement |
|---|---|---|---|---|
| 2025 | $561 | $12,890 | $900 | $11,990 |
| 2024 | $561 | $12,890 | $900 | $11,990 |
| 2023 | $552 | $12,890 | $900 | $11,990 |
| 2022 | $458 | $9,120 | $820 | $8,300 |
| 2021 | $643 | $9,120 | $820 | $8,300 |
| 2020 | $444 | $9,120 | $820 | $8,300 |
| 2019 | $419 | $8,090 | $1,050 | $7,040 |
| 2018 | $420 | $8,090 | $1,050 | $7,040 |
| 2017 | $409 | $8,090 | $1,050 | $7,040 |
| 2016 | $410 | $7,740 | $1,050 | $6,690 |
| 2015 | $411 | $7,740 | $1,050 | $6,690 |
| 2014 | $393 | $7,740 | $1,050 | $6,690 |
Source: Public Records
Map
Nearby Homes
Your Personal Tour Guide
Ask me questions while you tour the home.