Estimated Value: $163,000 - $192,000
3
Beds
2
Baths
1,338
Sq Ft
$132/Sq Ft
Est. Value
About This Home
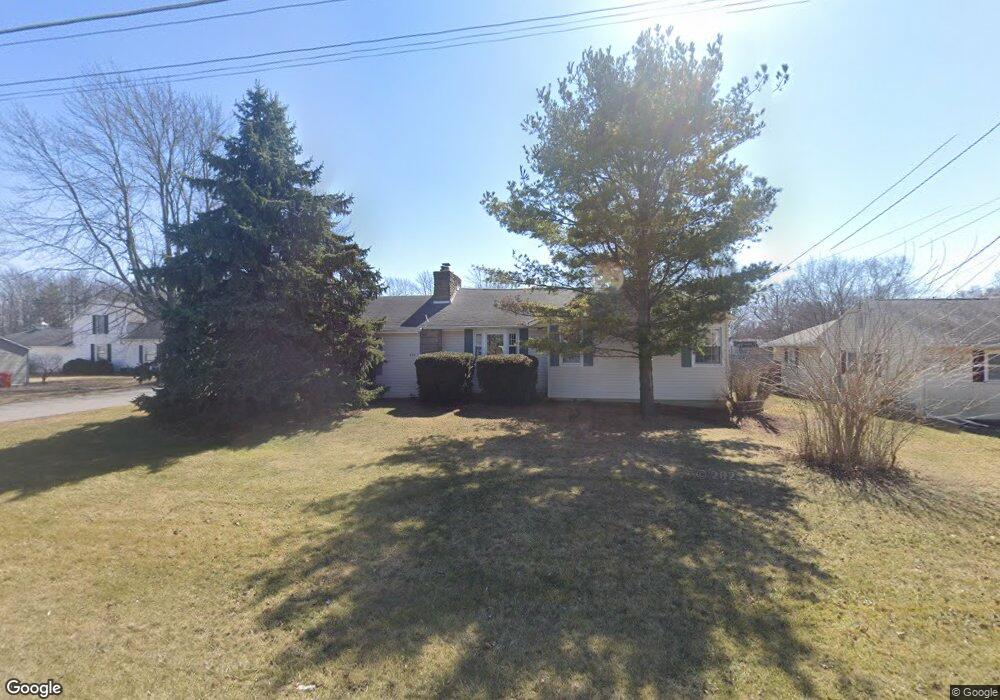
This home is located at 409 E North Ave, Ada, OH 45810 and is currently estimated at $175,983, approximately $131 per square foot. 409 E North Ave is a home located in Hardin County with nearby schools including Ada Elementary School and Ada High School.
Ownership History
Date
Name
Owned For
Owner Type
Purchase Details
Closed on
Apr 4, 2014
Sold by
Jpmorgan Chase Bank Na
Bought by
Simon Jared L
Current Estimated Value
Home Financials for this Owner
Home Financials are based on the most recent Mortgage that was taken out on this home.
Original Mortgage
$73,469
Outstanding Balance
$55,997
Interest Rate
4.41%
Mortgage Type
New Conventional
Estimated Equity
$119,986
Purchase Details
Closed on
Jan 29, 2013
Sold by
Barrett Chelsy C and Waughtel Richard H
Bought by
Jpmorgan Chase Bank Na
Purchase Details
Closed on
Nov 14, 2011
Sold by
Rogers Morris W
Bought by
Waughtel Richard H and Barrett Chelsy C
Home Financials for this Owner
Home Financials are based on the most recent Mortgage that was taken out on this home.
Original Mortgage
$97,959
Interest Rate
4.08%
Mortgage Type
New Conventional
Create a Home Valuation Report for This Property
The Home Valuation Report is an in-depth analysis detailing your home's value as well as a comparison with similar homes in the area
Home Values in the Area
Average Home Value in this Area
Purchase History
| Date | Buyer | Sale Price | Title Company |
|---|---|---|---|
| Simon Jared L | $72,000 | American Title Resources In | |
| Jpmorgan Chase Bank Na | $91,800 | None Available | |
| Waughtel Richard H | $94,500 | None Available |
Source: Public Records
Mortgage History
| Date | Status | Borrower | Loan Amount |
|---|---|---|---|
| Open | Simon Jared L | $73,469 | |
| Previous Owner | Waughtel Richard H | $97,959 |
Source: Public Records
Tax History
| Year | Tax Paid | Tax Assessment Tax Assessment Total Assessment is a certain percentage of the fair market value that is determined by local assessors to be the total taxable value of land and additions on the property. | Land | Improvement |
|---|---|---|---|---|
| 2024 | $1,811 | $46,370 | $3,540 | $42,830 |
| 2023 | $1,799 | $46,370 | $3,540 | $42,830 |
| 2022 | $1,607 | $36,140 | $3,410 | $32,730 |
| 2021 | $1,763 | $36,140 | $3,410 | $32,730 |
| 2020 | $1,786 | $36,140 | $3,410 | $32,730 |
| 2019 | $1,597 | $32,670 | $3,240 | $29,430 |
| 2018 | $1,563 | $32,670 | $3,240 | $29,430 |
| 2017 | $1,537 | $32,670 | $3,240 | $29,430 |
| 2016 | $1,545 | $34,810 | $3,140 | $31,670 |
| 2015 | $1,484 | $34,810 | $3,140 | $31,670 |
| 2014 | $1,544 | $34,810 | $3,140 | $31,670 |
| 2013 | $1,519 | $36,680 | $3,140 | $33,540 |
Source: Public Records
Map
Nearby Homes
- 503 E North Ave
- 442 Edwards St
- 746 N Main St Unit 61
- 746 N Main St Unit 63
- 746 N Main St Unit 74
- 746 N Main St Unit 9
- 746 N Main St Unit 35
- 746 N Main St Unit 5
- 746 N Main St Unit 39
- 530 N Main St
- 724 N Main St
- 629 N Main St
- 128 W North Ave
- 211 S Main St
- 327 W North Ave
- 210 N Gilbert St
- 308-310 S Simon St
- 314 E University Ave
- 602 Conley Ave
- 710 S Main St
Your Personal Tour Guide
Ask me questions while you tour the home.