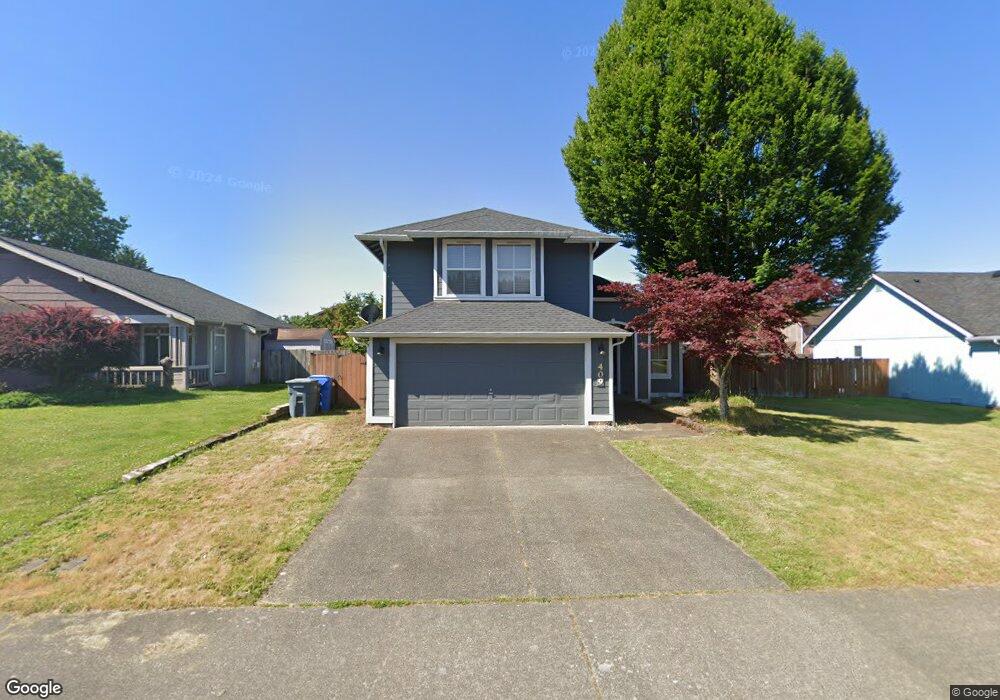
409 Eldredge Ave NW Orting, WA 98360
Estimated Value: $446,000 - $510,000
3
Beds
3
Baths
1,352
Sq Ft
$354/Sq Ft
Est. Value
About This Home
This home is located at 409 Eldredge Ave NW, Orting, WA 98360 and is currently estimated at $478,643, approximately $354 per square foot. 409 Eldredge Ave NW is a home located in Pierce County with nearby schools including Orting Elementary School, Ptarmigan Ridge Elementary School, and Orting Middle School.
Ownership History
Date
Name
Owned For
Owner Type
Purchase Details
Closed on
Oct 27, 2016
Sold by
Cross Lora M and Spencer Lora M
Bought by
Cross Lora M and Cross Shaun K
Current Estimated Value
Home Financials for this Owner
Home Financials are based on the most recent Mortgage that was taken out on this home.
Original Mortgage
$146,000
Outstanding Balance
$69,379
Interest Rate
3.5%
Mortgage Type
New Conventional
Estimated Equity
$409,264
Purchase Details
Closed on
Jun 12, 2013
Sold by
Rathbun Ford A
Bought by
Rathbun Laurie L and Rathbun Ford A
Purchase Details
Closed on
Jul 6, 2011
Sold by
Federal Home Loan Mortgage Corporation
Bought by
Spencer Lora M
Home Financials for this Owner
Home Financials are based on the most recent Mortgage that was taken out on this home.
Original Mortgage
$157,202
Interest Rate
4.54%
Mortgage Type
New Conventional
Purchase Details
Closed on
Mar 2, 2011
Sold by
Mapes Adam C
Bought by
Federal Home Loan Mortgage Corp
Purchase Details
Closed on
Sep 27, 2007
Sold by
Mapes Heather
Bought by
Mapes Adam C
Home Financials for this Owner
Home Financials are based on the most recent Mortgage that was taken out on this home.
Original Mortgage
$224,910
Interest Rate
6.61%
Mortgage Type
Purchase Money Mortgage
Purchase Details
Closed on
Sep 26, 2007
Sold by
Hope Jeffrey H and Hope Robin
Bought by
Mapes Adam C
Home Financials for this Owner
Home Financials are based on the most recent Mortgage that was taken out on this home.
Original Mortgage
$224,910
Interest Rate
6.61%
Mortgage Type
Purchase Money Mortgage
Purchase Details
Closed on
Aug 15, 2005
Sold by
Townsend Eugene F
Bought by
Hope Jeffrey H and Hope Robin
Home Financials for this Owner
Home Financials are based on the most recent Mortgage that was taken out on this home.
Original Mortgage
$180,000
Interest Rate
5.99%
Mortgage Type
Purchase Money Mortgage
Purchase Details
Closed on
Feb 20, 1997
Sold by
Dean Housley Company Llc
Bought by
Townsend Eugene F and Townsend Leslie N
Home Financials for this Owner
Home Financials are based on the most recent Mortgage that was taken out on this home.
Original Mortgage
$122,700
Interest Rate
7.86%
Mortgage Type
FHA
Purchase Details
Closed on
Jan 27, 1997
Sold by
River Shores Ltd Partnership
Bought by
Dean Housley Company Llc
Home Financials for this Owner
Home Financials are based on the most recent Mortgage that was taken out on this home.
Original Mortgage
$122,700
Interest Rate
7.86%
Mortgage Type
FHA
Create a Home Valuation Report for This Property
The Home Valuation Report is an in-depth analysis detailing your home's value as well as a comparison with similar homes in the area
Home Values in the Area
Average Home Value in this Area
Purchase History
| Date | Buyer | Sale Price | Title Company |
|---|---|---|---|
| Cross Lora M | -- | Fidelity National Title | |
| Rathbun Laurie L | -- | None Available | |
| Spencer Lora M | -- | Northwest Title | |
| Federal Home Loan Mortgage Corp | $155,988 | None Available | |
| Mapes Adam C | -- | Stewart Title | |
| Mapes Adam C | $249,900 | Stewart Title | |
| Hope Jeffrey H | $225,000 | Chicago Title Insurance Co | |
| Townsend Eugene F | $123,950 | Transnation Title Insurance | |
| Dean Housley Company Llc | $230,219 | Transnation Title Insurance |
Source: Public Records
Mortgage History
| Date | Status | Borrower | Loan Amount |
|---|---|---|---|
| Open | Cross Lora M | $146,000 | |
| Closed | Spencer Lora M | $157,202 | |
| Previous Owner | Mapes Adam C | $224,910 | |
| Previous Owner | Hope Jeffrey H | $180,000 | |
| Previous Owner | Townsend Eugene F | $122,700 |
Source: Public Records
Tax History
| Year | Tax Paid | Tax Assessment Tax Assessment Total Assessment is a certain percentage of the fair market value that is determined by local assessors to be the total taxable value of land and additions on the property. | Land | Improvement |
|---|---|---|---|---|
| 2025 | $3,525 | $429,200 | $186,000 | $243,200 |
| 2024 | $3,525 | $408,900 | $176,200 | $232,700 |
| 2023 | $3,525 | $379,900 | $168,400 | $211,500 |
| 2022 | $3,427 | $393,000 | $168,400 | $224,600 |
| 2021 | $3,304 | $272,800 | $112,500 | $160,300 |
| 2019 | $2,943 | $244,600 | $95,400 | $149,200 |
| 2018 | $3,030 | $228,300 | $83,100 | $145,200 |
| 2017 | $2,825 | $200,900 | $66,800 | $134,100 |
| 2016 | $2,602 | $167,100 | $51,700 | $115,400 |
| 2014 | $2,138 | $155,300 | $46,200 | $109,100 |
| 2013 | $2,138 | $128,500 | $36,300 | $92,200 |
Source: Public Records
Map
Nearby Homes
- 310 Orting Ave NW
- 215 Corrin Ave NW Unit C
- 215 Corrin Ave NW Unit B
- 215 Corrin Ave NW Unit D
- 215 Corrin Ave NW Unit A
- 316 Bowlin Ave NE
- 121 van Scoyoc Ave SW
- 724 Teetor Cir NW Unit LOT 12
- 722 Teetor Cir NW Unit Lot 11
- 726 Teetor Cir NW Unit Lot 13
- 718 Teetor Cir NW Unit LOT 9
- 213 Bridge St SW
- 211 Bridge St SW
- 716 Teetor Cir NW Unit Lot 08
- 727 Teetor Cir NW Unit Lot 16
- 734 Teetor Cir NW Unit Lot 33
- 725 Teetor Cir NW Unit Lot 17
- 732 Teetor Cir NW Unit Lot 32
- 723 Teetor Cir NW Unit LOT 18
- 721 Teetor Cir NW Unit Lot 19
- 407 Eldredge Ave NW
- 411 Eldredge Ave NW
- 408 Kensington Ave NW
- 410 Kensington Ave NW
- 405 Eldredge Ave NW
- 413 Eldredge Ave NW
- 406 Kensington Ave NW
- 410 Eldredge Ave NW
- 412 Kensington Ave NW
- 408 Eldredge Ave NW
- 412 Eldredge Ave NW
- 206 Calendar Ct NW
- 404 Kensington Ave NW
- 403 Eldredge Ave NW
- 414 Eldredge Ave NW
- 414 Kensington Ave NW
- 416 Eldredge Ave NW
- 203 Calendar Ct NW
- 205 Callendar Ct NW
- 303 Callendar St NW
Your Personal Tour Guide
Ask me questions while you tour the home.