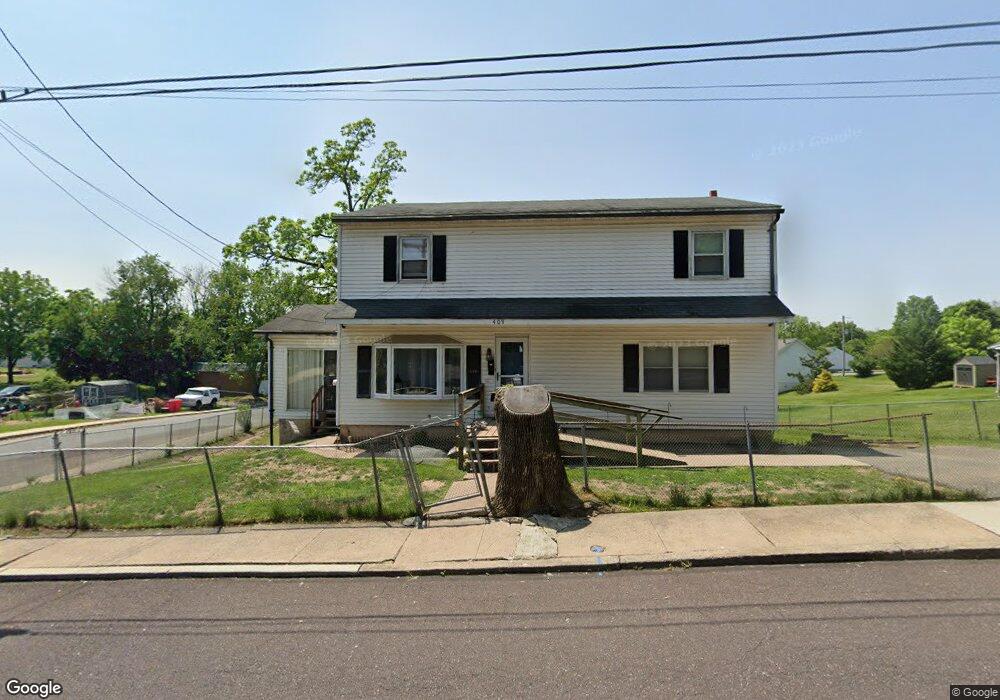
409 Elm St Pottstown, PA 19464
Estimated Value: $343,000 - $368,165
4
Beds
2
Baths
2,124
Sq Ft
$167/Sq Ft
Est. Value
About This Home
This home is located at 409 Elm St, Pottstown, PA 19464 and is currently estimated at $354,291, approximately $166 per square foot. 409 Elm St is a home located in Montgomery County with nearby schools including Lower Pottsgrove Elementary School, Pottsgrove Middle School, and Pottsgrove Senior High School.
Ownership History
Date
Name
Owned For
Owner Type
Purchase Details
Closed on
May 11, 2018
Sold by
Clemons Tranis
Bought by
Ganns Deborah
Current Estimated Value
Home Financials for this Owner
Home Financials are based on the most recent Mortgage that was taken out on this home.
Original Mortgage
$117,826
Outstanding Balance
$101,685
Interest Rate
4.5%
Mortgage Type
FHA
Estimated Equity
$252,606
Purchase Details
Closed on
Oct 31, 1967
Bought by
Clemmons Tranies and Clemmons Dorothy J
Create a Home Valuation Report for This Property
The Home Valuation Report is an in-depth analysis detailing your home's value as well as a comparison with similar homes in the area
Home Values in the Area
Average Home Value in this Area
Purchase History
| Date | Buyer | Sale Price | Title Company |
|---|---|---|---|
| Ganns Deborah | $120,000 | -- | |
| Clemmons Tranies | -- | -- |
Source: Public Records
Mortgage History
| Date | Status | Borrower | Loan Amount |
|---|---|---|---|
| Open | Ganns Deborah | $117,826 |
Source: Public Records
Tax History Compared to Growth
Tax History
| Year | Tax Paid | Tax Assessment Tax Assessment Total Assessment is a certain percentage of the fair market value that is determined by local assessors to be the total taxable value of land and additions on the property. | Land | Improvement |
|---|---|---|---|---|
| 2025 | $6,178 | $128,600 | $35,560 | $93,040 |
| 2024 | $6,178 | $128,600 | $35,560 | $93,040 |
| 2023 | $5,982 | $128,600 | $35,560 | $93,040 |
| 2022 | $5,889 | $128,600 | $35,560 | $93,040 |
| 2021 | $5,803 | $128,600 | $35,560 | $93,040 |
| 2020 | $5,716 | $128,600 | $35,560 | $93,040 |
| 2019 | $5,686 | $128,600 | $35,560 | $93,040 |
| 2018 | $5,686 | $128,600 | $35,560 | $93,040 |
| 2017 | $5,667 | $128,600 | $35,560 | $93,040 |
| 2016 | $5,617 | $128,600 | $35,560 | $93,040 |
| 2015 | $5,422 | $128,600 | $35,560 | $93,040 |
| 2014 | $5,422 | $128,600 | $35,560 | $93,040 |
Source: Public Records
Map
Nearby Homes
- 160 Linden St Unit 69
- 530 E Howard St
- 501 and 507 E Race St
- 104 Pulaski St
- 334 Lemon St
- 1036 Edgewood Dr
- 703 Holly Dr
- 8 Ryan St
- 601 W High St
- 356 W Beech St Unit 160
- 1209 Grosstown Rd
- 0 Ash St Unit PAMC2144590
- 377 Circle of Progress Dr
- 536 & 538 W Vine St
- 1405 Old Glasgow St
- 94 Random Rd
- 25 Random Rd
- 666 Manatawny St
- 129 Rattlesnake Hill Rd
- 443 Manatawny St