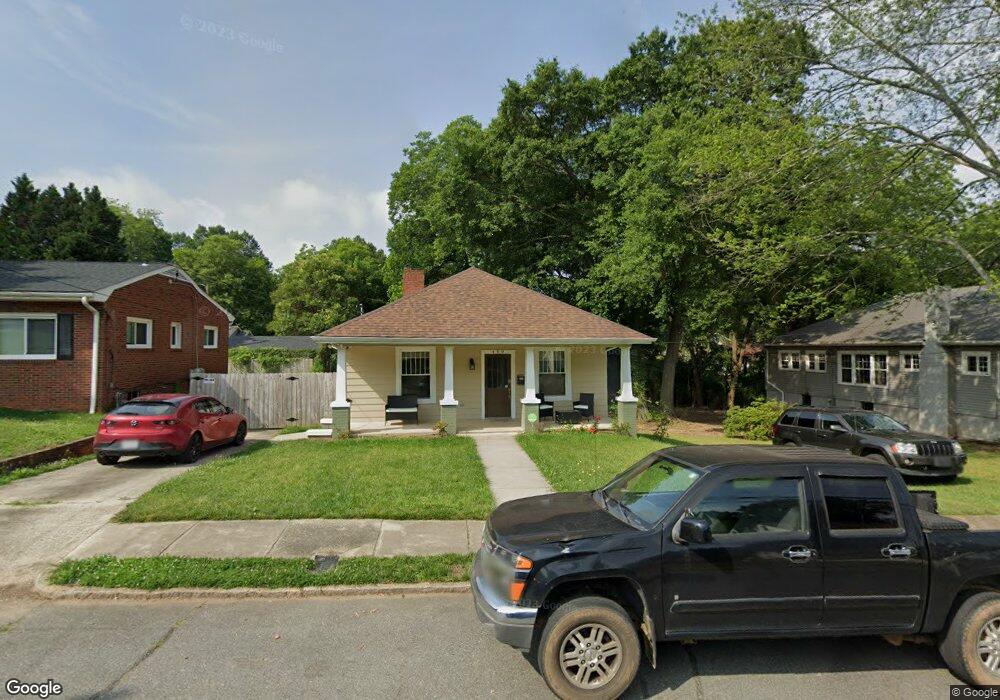
409 Elm St Salisbury, NC 28144
Estimated Value: $195,000 - $216,000
2
Beds
2
Baths
1,160
Sq Ft
$177/Sq Ft
Est. Value
About This Home
This home is located at 409 Elm St, Salisbury, NC 28144 and is currently estimated at $205,662, approximately $177 per square foot. 409 Elm St is a home located in Rowan County with nearby schools including Elizabeth Duncan Koontz Elementary School, North Rowan Middle School, and Salisbury High School.
Ownership History
Date
Name
Owned For
Owner Type
Purchase Details
Closed on
Mar 1, 2022
Sold by
Kate Morrison Laura
Bought by
Capps Justin and Roseman Elyse
Current Estimated Value
Home Financials for this Owner
Home Financials are based on the most recent Mortgage that was taken out on this home.
Original Mortgage
$174,600
Outstanding Balance
$161,199
Interest Rate
3.55%
Mortgage Type
New Conventional
Estimated Equity
$44,463
Purchase Details
Closed on
Dec 27, 2018
Sold by
Crooms Kenneth
Bought by
Morrison Laura Kate
Home Financials for this Owner
Home Financials are based on the most recent Mortgage that was taken out on this home.
Original Mortgage
$110,000
Interest Rate
4.9%
Mortgage Type
New Conventional
Purchase Details
Closed on
May 1, 2018
Sold by
Lipscomb Al and Lipscomb Mae F
Bought by
Crooms Kenneth
Purchase Details
Closed on
Apr 26, 2002
Bought by
Lipscomb Al and Lipscomb Wf
Create a Home Valuation Report for This Property
The Home Valuation Report is an in-depth analysis detailing your home's value as well as a comparison with similar homes in the area
Home Values in the Area
Average Home Value in this Area
Purchase History
| Date | Buyer | Sale Price | Title Company |
|---|---|---|---|
| Capps Justin | $180,000 | Nance & Overbey Pllc | |
| Morrison Laura Kate | $135,000 | Netco Title | |
| Crooms Kenneth | $15,000 | None Available | |
| Lipscomb Al | -- | -- |
Source: Public Records
Mortgage History
| Date | Status | Borrower | Loan Amount |
|---|---|---|---|
| Open | Capps Justin | $174,600 | |
| Closed | Capps Justin | $174,600 | |
| Previous Owner | Morrison Laura Kate | $110,000 |
Source: Public Records
Tax History
| Year | Tax Paid | Tax Assessment Tax Assessment Total Assessment is a certain percentage of the fair market value that is determined by local assessors to be the total taxable value of land and additions on the property. | Land | Improvement |
|---|---|---|---|---|
| 2025 | $2,106 | $176,097 | $17,850 | $158,247 |
| 2024 | $2,106 | $176,097 | $17,850 | $158,247 |
| 2023 | $2,106 | $176,097 | $17,850 | $158,247 |
| 2022 | $1,301 | $94,454 | $14,700 | $79,754 |
| 2021 | $1,301 | $94,454 | $14,700 | $79,754 |
| 2020 | $1,301 | $94,454 | $14,700 | $79,754 |
| 2019 | $1,301 | $94,454 | $14,700 | $79,754 |
| 2018 | $602 | $45,423 | $14,700 | $30,723 |
| 2017 | $276 | $45,423 | $14,700 | $30,723 |
| 2016 | $268 | $45,423 | $14,700 | $30,723 |
| 2015 | $270 | $45,423 | $14,700 | $30,723 |
| 2014 | $287 | $46,959 | $14,700 | $32,259 |
Source: Public Records
Map
Nearby Homes
- 522 Elm St
- 835 Maple Ave
- 502 Mitchell Ave
- 304 Mitchell Ave
- 425 Maupin Ave
- 208 Maupin Ave
- 301 Maupin Ave
- 953 Fairmont Ave
- 218 Queen Anne Rd
- 207 Maupin Ave
- 515 Heilig Ave
- 1418 Crosby St
- 1027 Old Plank Rd
- 1007 S Church St
- 817 S Jackson St
- 214 Chestnut St
- 201 W McCubbins St
- 204 W C Ave
- 603 S Fulton St
- 1219 Old Wilkesboro Rd
Your Personal Tour Guide
Ask me questions while you tour the home.