Estimated Value: $329,786 - $351,000
3
Beds
2
Baths
1,758
Sq Ft
$193/Sq Ft
Est. Value
About This Home
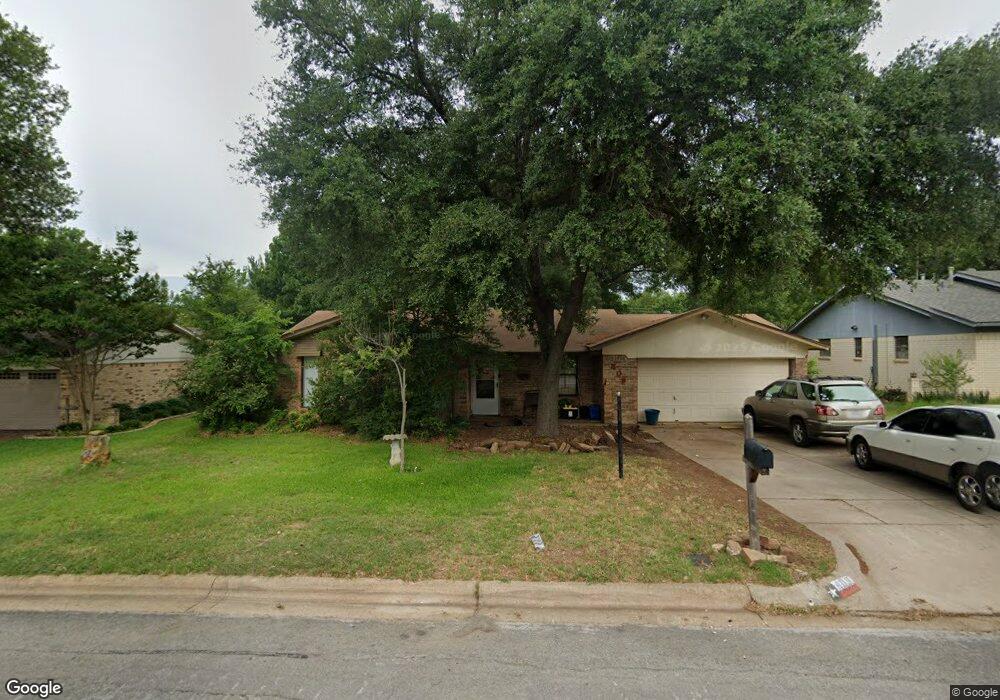
This home is located at 409 Englewood Ln, Hurst, TX 76053 and is currently estimated at $339,197, approximately $192 per square foot. 409 Englewood Ln is a home located in Tarrant County with nearby schools including Hurst Hills Elementary School, Hurst J High School, and L.D. Bell High School.
Ownership History
Date
Name
Owned For
Owner Type
Purchase Details
Closed on
Jan 31, 1997
Sold by
Golden Layne and Golden Wendy J
Bought by
Price Michael S and Price Jacqueline M
Current Estimated Value
Home Financials for this Owner
Home Financials are based on the most recent Mortgage that was taken out on this home.
Original Mortgage
$80,350
Outstanding Balance
$9,322
Interest Rate
7.85%
Mortgage Type
Seller Take Back
Estimated Equity
$329,875
Create a Home Valuation Report for This Property
The Home Valuation Report is an in-depth analysis detailing your home's value as well as a comparison with similar homes in the area
Home Values in the Area
Average Home Value in this Area
Purchase History
| Date | Buyer | Sale Price | Title Company |
|---|---|---|---|
| Price Michael S | -- | Lone Star Title |
Source: Public Records
Mortgage History
| Date | Status | Borrower | Loan Amount |
|---|---|---|---|
| Open | Price Michael S | $80,350 |
Source: Public Records
Tax History Compared to Growth
Tax History
| Year | Tax Paid | Tax Assessment Tax Assessment Total Assessment is a certain percentage of the fair market value that is determined by local assessors to be the total taxable value of land and additions on the property. | Land | Improvement |
|---|---|---|---|---|
| 2025 | $3,812 | $283,487 | $63,875 | $219,612 |
| 2024 | $3,812 | $283,487 | $63,875 | $219,612 |
| 2023 | $4,759 | $237,543 | $53,100 | $184,443 |
| 2022 | $4,996 | $220,174 | $53,130 | $167,044 |
| 2021 | $4,757 | $197,249 | $50,000 | $147,249 |
| 2020 | $4,904 | $203,844 | $50,000 | $153,844 |
| 2019 | $4,726 | $205,255 | $50,000 | $155,255 |
| 2018 | $3,711 | $175,559 | $25,000 | $150,559 |
| 2017 | $4,039 | $179,316 | $25,000 | $154,316 |
| 2016 | $3,672 | $162,021 | $25,000 | $137,021 |
| 2015 | $3,024 | $131,900 | $20,000 | $111,900 |
| 2014 | $3,024 | $131,900 | $20,000 | $111,900 |
Source: Public Records
Map
Nearby Homes
- 405 Billy Creek Cir
- 425 Moore Creek Rd
- 512 Billie Ruth Ln
- 808 Betty Ct
- 1200 Walker Dr
- 1112 Blakey Ct
- 741 Ponderosa Dr
- 649 Timberline Dr
- 632 Melbourne Ct
- 758 Briarwood Ln
- 756 Briarwood Ln
- 425 Ridgecrest Dr
- 637 Post Oak Dr
- 744 Briarwood Ln
- 1304 W Redbud Dr
- 3216 Fountain Pkwy
- 228 Arcadia St
- 628 Elm St
- 520 W Redbud Dr
- 8308 Fall Crest Dr
- 413 Englewood Ln
- 405 Englewood Ln
- 417 Englewood Ln
- 401 Englewood Ln
- 908 Henson Dr
- 408 Englewood Ln
- 404 Englewood Ln
- 421 Englewood Ln
- 412 Englewood Ln
- 400 Englewood Ln
- 416 Englewood Ln
- 425 Englewood Ln
- 420 Englewood Ln
- 905 Henson Dr
- 901 Henson Dr
- 409 Apple Blossom Ln
- 405 Apple Blossom Ln
- 857 Henson Dr
- 413 Apple Blossom Ln
- 401 Apple Blossom Ln