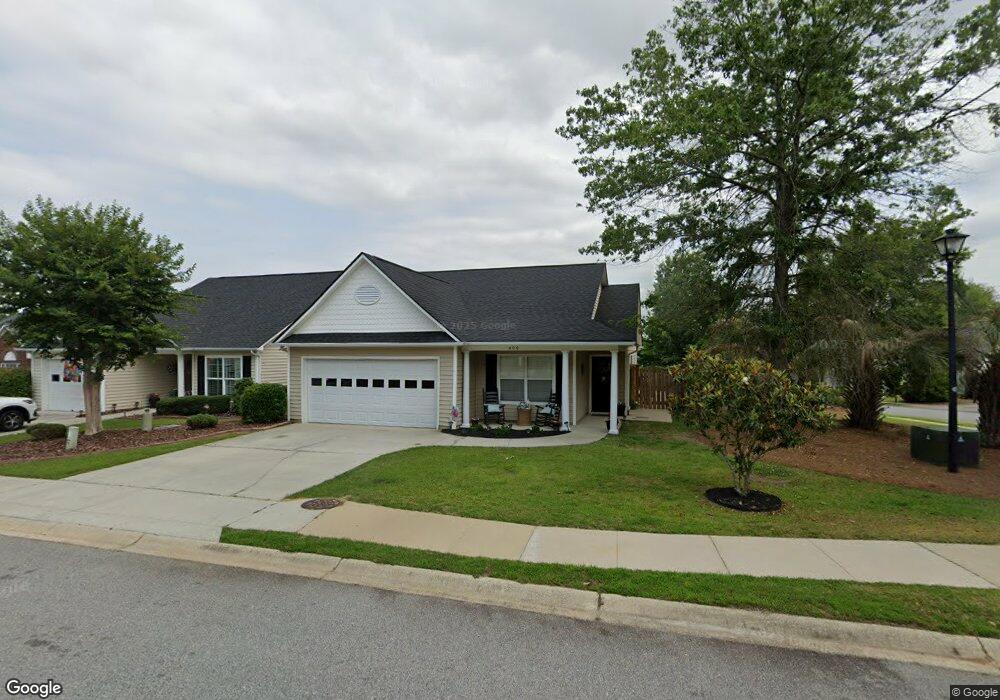
409 Garden Arbor Ln Lexington, SC 29072
Estimated Value: $218,000 - $255,000
2
Beds
2
Baths
1,281
Sq Ft
$180/Sq Ft
Est. Value
About This Home
This home is located at 409 Garden Arbor Ln, Lexington, SC 29072 and is currently estimated at $230,685, approximately $180 per square foot. 409 Garden Arbor Ln is a home located in Lexington County with nearby schools including Lake Murray Elementary School, Beechwood Middle School, and Lexington High School.
Ownership History
Date
Name
Owned For
Owner Type
Purchase Details
Closed on
Feb 16, 2022
Sold by
Marilyn P Spagnola Irrevocable Trust
Bought by
Gardner Lindsey Elizabeth
Current Estimated Value
Home Financials for this Owner
Home Financials are based on the most recent Mortgage that was taken out on this home.
Original Mortgage
$160,550
Outstanding Balance
$149,083
Interest Rate
3.55%
Mortgage Type
New Conventional
Estimated Equity
$81,602
Purchase Details
Closed on
Oct 25, 2021
Sold by
Spagnola Marilyn P
Bought by
Woodham Andrew D and Spacinola Marilyn P
Purchase Details
Closed on
Mar 11, 2020
Sold by
Spagnola Marilyn P and Estat Of Robert Carl Spagnola
Bought by
Spagnola Marilyn P
Purchase Details
Closed on
Nov 25, 2013
Sold by
Porterfield Shirley Shull and Cook Shirley Shull
Bought by
Spagnola Robert C and Spagnola Marilyn P
Create a Home Valuation Report for This Property
The Home Valuation Report is an in-depth analysis detailing your home's value as well as a comparison with similar homes in the area
Home Values in the Area
Average Home Value in this Area
Purchase History
| Date | Buyer | Sale Price | Title Company |
|---|---|---|---|
| Gardner Lindsey Elizabeth | $169,000 | Blair Cato Pickren Casterline | |
| Woodham Andrew D | -- | None Available | |
| Spagnola Marilyn P | -- | None Available | |
| Spagnola Robert C | $118,000 | -- |
Source: Public Records
Mortgage History
| Date | Status | Borrower | Loan Amount |
|---|---|---|---|
| Open | Gardner Lindsey Elizabeth | $160,550 |
Source: Public Records
Tax History Compared to Growth
Tax History
| Year | Tax Paid | Tax Assessment Tax Assessment Total Assessment is a certain percentage of the fair market value that is determined by local assessors to be the total taxable value of land and additions on the property. | Land | Improvement |
|---|---|---|---|---|
| 2024 | $1,186 | $6,760 | $1,600 | $5,160 |
| 2023 | $1,186 | $5,428 | $1,107 | $4,321 |
| 2022 | $486 | $5,428 | $1,107 | $4,321 |
| 2020 | $505 | $5,428 | $1,107 | $4,321 |
| 2019 | $408 | $4,720 | $1,000 | $3,720 |
| 2018 | $404 | $4,720 | $1,000 | $3,720 |
| 2017 | $387 | $4,720 | $1,000 | $3,720 |
| 2016 | $394 | $4,719 | $1,000 | $3,719 |
| 2014 | $379 | $4,720 | $1,000 | $3,720 |
| 2013 | -- | $7,100 | $1,500 | $5,600 |
Source: Public Records
Map
Nearby Homes
- 108 Dupre Mill Rd
- 108 Misty Dew Ln
- 247 Clearbrook Cir
- 213 Dove Chase Trail
- 125 Misty Dew Ln
- 157 Autumn Stroll Ct
- 605 Bronze Fantail Run
- 524 Silver Dipper Run
- 413 Jordan Way
- 222 Forgotten Trail
- 218 Forgotten Trail
- 214 Forgotten Trail
- 220 Forgotten Trail
- 216 Forgotten Trail
- 208 Forgotten Trail
- 224 Forgotten Trail
- 204 Forgotten Trail
- 200 Forgotten Trail
- 206 Forgotten Trail
- 210 Forgotten Trail
- 407 Garden Arbor Ln
- 405 Garden Arbor Ln
- 501 Garden Arbor Ln
- 410 Garden Arbor Ln
- 412 Garden Arbor Ln
- 408 Garden Arbor Ln
- 109 Wilmington Ln
- 406 Garden Arbor Ln
- 111 Wilmington Ln
- 503 Garden Arbor Ln
- 500 Garden Arbor Ln
- 107 Wilmington Ln
- 105 Wilmington Ln
- 404 Garden Arbor Ln
- 502 Garden Arbor Ln
- 103 Wilmington Ln
- 308 Garden Arbor Dr
- 505 Garden Arbor Ln
- 306 Garden Arbor Dr
- 304 Garden Arbor Dr