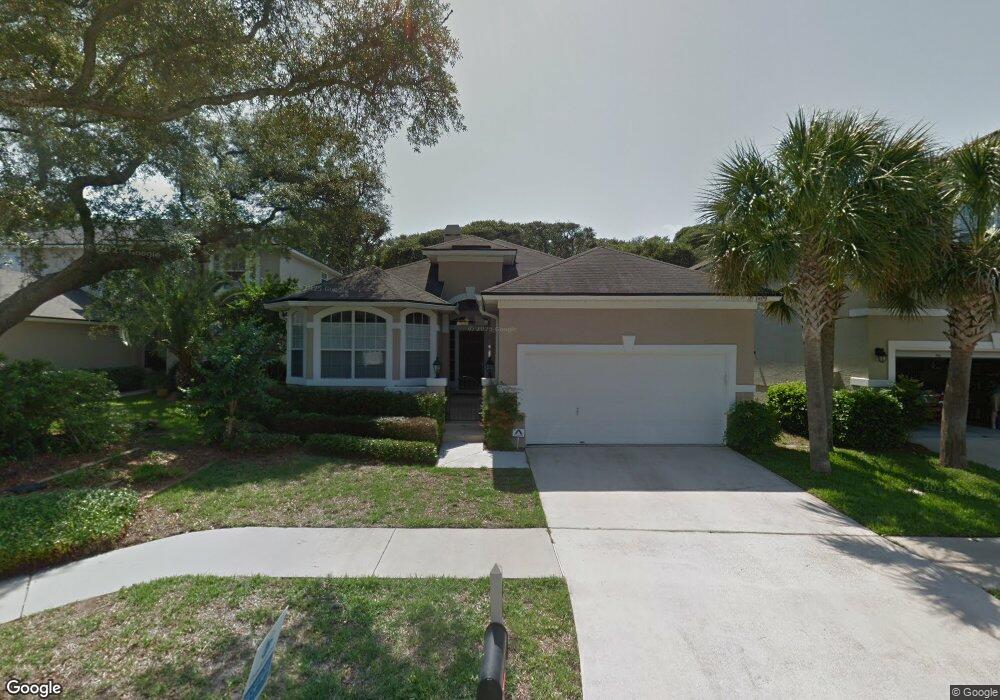
409 Georgia Ave Fernandina Beach, FL 32034
Estimated Value: $672,882 - $897,000
3
Beds
2
Baths
2,129
Sq Ft
$355/Sq Ft
Est. Value
About This Home
This home is located at 409 Georgia Ave, Fernandina Beach, FL 32034 and is currently estimated at $755,471, approximately $354 per square foot. 409 Georgia Ave is a home located in Nassau County with nearby schools including Southside Elementary School, Emma Love Hardee Elementary School, and Fernandina Beach Middle School.
Ownership History
Date
Name
Owned For
Owner Type
Purchase Details
Closed on
Jul 22, 2020
Sold by
Sweeley Maynard E and Richards Trudene L
Bought by
Sweeley Maynard E
Current Estimated Value
Purchase Details
Closed on
Sep 1, 2015
Sold by
Sweeley Maynard Earl and Richards Trudene Lorraine
Bought by
Maynard E Sweely Revocable Trust and Richards Trudene L
Purchase Details
Closed on
Jun 15, 2011
Sold by
Mashburn Farrel S and Mashburn Karen D
Bought by
Sweeley Maynard Earl and Richards Trudene Lorraine
Purchase Details
Closed on
Aug 2, 2005
Sold by
Mashburn Karen D and Mashburn Farrell S
Bought by
Mashburn Karen D and Mashburn Farrell S
Purchase Details
Closed on
May 14, 2001
Sold by
Beazer Homes Corp
Bought by
Mashburn Farrell S and Mashburn Karen
Home Financials for this Owner
Home Financials are based on the most recent Mortgage that was taken out on this home.
Original Mortgage
$100,000
Interest Rate
6.53%
Create a Home Valuation Report for This Property
The Home Valuation Report is an in-depth analysis detailing your home's value as well as a comparison with similar homes in the area
Home Values in the Area
Average Home Value in this Area
Purchase History
| Date | Buyer | Sale Price | Title Company |
|---|---|---|---|
| Sweeley Maynard E | -- | Review Of Opinion Of Title | |
| Sweeley Maynard E | $100 | Law Office Of Kristen D Drake | |
| Maynard E Sweely Revocable Trust | -- | Attorney | |
| Sweeley Maynard Earl | $279,900 | Attorney | |
| Mashburn Karen D | -- | -- | |
| Mashburn Karen D | -- | -- | |
| Mashburn Farrell S | $214,700 | -- |
Source: Public Records
Mortgage History
| Date | Status | Borrower | Loan Amount |
|---|---|---|---|
| Previous Owner | Mashburn Farrell S | $100,000 |
Source: Public Records
Tax History Compared to Growth
Tax History
| Year | Tax Paid | Tax Assessment Tax Assessment Total Assessment is a certain percentage of the fair market value that is determined by local assessors to be the total taxable value of land and additions on the property. | Land | Improvement |
|---|---|---|---|---|
| 2024 | $2,691 | $293,580 | -- | -- |
| 2023 | $2,691 | $285,029 | $0 | $0 |
| 2022 | $2,528 | $276,727 | $0 | $0 |
| 2021 | $2,525 | $268,667 | $0 | $0 |
| 2020 | $2,547 | $264,958 | $0 | $0 |
| 2019 | $2,614 | $259,001 | $0 | $0 |
| 2018 | $2,524 | $254,172 | $0 | $0 |
| 2017 | $2,418 | $248,944 | $0 | $0 |
| 2016 | $2,396 | $243,824 | $0 | $0 |
| 2015 | $2,410 | $242,129 | $0 | $0 |
| 2014 | $2,403 | $240,207 | $0 | $0 |
Source: Public Records
Map
Nearby Homes
- 382 S Fletcher Ave Unit 101
- 382 S Fletcher Ave Unit 306
- 382 S Fletcher Ave Unit 302
- 348-B S Fletcher Ave
- 454 S Fletcher Ave
- Lot 5 S Fletcher Ave
- 0 Gregor McGregor Blvd Unit 114011
- 0 Gregor McGregor Blvd Unit 113468
- 669 S Fletcher Ave
- 32 S Fletcher Ave Unit 105
- 32 S Fletcher Ave Unit 101
- 991 Ocean Bluff Dr
- 778 S Fletcher Ave
- 794 S Fletcher Ave
- 855 S Fletcher Ave
- 412 Citrona Dr
- 342 Tarpon Ave Unit 1
- 344 Tarpon Ave
- 348 Tarpon Ave
- 403 Tarpon Ave Unit 221
- 411 Georgia Ave
- 405 Georgia Ave
- 413 Georgia Ave
- 415 Georgia Ave
- 403 Georgia Ave
- 408 Georgia Ave
- 410 Georgia Ave
- 406 Georgia Ave
- 404 Georgia Ave
- 412 Georgia Ave
- 402 Georgia Ave
- 417 Georgia Ave
- 401 Georgia Ave
- 414 Georgia Ave
- 400 Georgia Ave
- 419 Georgia Ave
- 416 Georgia Ave
- 2622 Georgia Ave
- 402 Portside Dr
- 404 Portside Dr