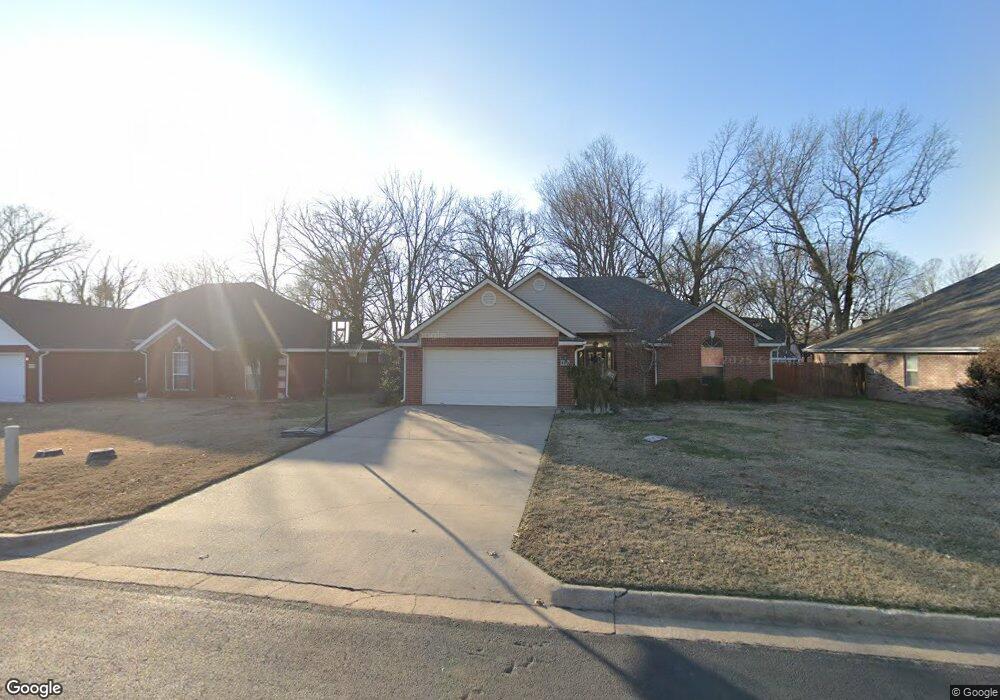
409 Gristmill Bentonville, AR 72712
Estimated Value: $383,033 - $464,000
--
Bed
3
Baths
1,585
Sq Ft
$272/Sq Ft
Est. Value
About This Home
This home is located at 409 Gristmill, Bentonville, AR 72712 and is currently estimated at $430,508, approximately $271 per square foot. 409 Gristmill is a home located in Benton County with nearby schools including Thomas Jefferson Elementary School, Lincoln Junior High School, and Ardis Ann Middle School.
Ownership History
Date
Name
Owned For
Owner Type
Purchase Details
Closed on
Sep 14, 2012
Sold by
Turner James Richard and Turner Conni Elizabeth
Bought by
Dell Shelly J
Current Estimated Value
Home Financials for this Owner
Home Financials are based on the most recent Mortgage that was taken out on this home.
Original Mortgage
$160,204
Outstanding Balance
$111,324
Interest Rate
3.66%
Mortgage Type
New Conventional
Estimated Equity
$319,184
Purchase Details
Closed on
Jul 17, 2010
Sold by
Turner James Richard and Turner Conni E
Bought by
Turner James Richard and Turner Conni Elizabeth
Purchase Details
Closed on
May 20, 2004
Bought by
Turner
Purchase Details
Closed on
Mar 13, 2003
Bought by
Kim
Purchase Details
Closed on
Jul 19, 1995
Bought by
Mcbeth
Purchase Details
Closed on
Jan 17, 1995
Bought by
Fleeman
Create a Home Valuation Report for This Property
The Home Valuation Report is an in-depth analysis detailing your home's value as well as a comparison with similar homes in the area
Home Values in the Area
Average Home Value in this Area
Purchase History
| Date | Buyer | Sale Price | Title Company |
|---|---|---|---|
| Dell Shelly J | $157,000 | None Available | |
| Turner James Richard | -- | None Available | |
| Turner | $270,000 | -- | |
| Nat'L Residential | -- | -- | |
| Turner | $270,000 | -- | |
| Nat'L Residential | -- | -- | |
| Kim | $129,000 | -- | |
| Mcbeth | $114,000 | -- | |
| Fleeman | $88,000 | -- |
Source: Public Records
Mortgage History
| Date | Status | Borrower | Loan Amount |
|---|---|---|---|
| Open | Dell Shelly J | $160,204 |
Source: Public Records
Tax History Compared to Growth
Tax History
| Year | Tax Paid | Tax Assessment Tax Assessment Total Assessment is a certain percentage of the fair market value that is determined by local assessors to be the total taxable value of land and additions on the property. | Land | Improvement |
|---|---|---|---|---|
| 2025 | $2,712 | $69,330 | $24,000 | $45,330 |
| 2024 | $2,601 | $69,330 | $24,000 | $45,330 |
| 2023 | $2,477 | $42,200 | $11,400 | $30,800 |
| 2022 | $2,052 | $42,200 | $11,400 | $30,800 |
| 2021 | $1,934 | $42,200 | $11,400 | $30,800 |
| 2020 | $1,846 | $34,860 | $7,400 | $27,460 |
| 2019 | $1,846 | $34,860 | $7,400 | $27,460 |
| 2018 | $1,813 | $34,860 | $7,400 | $27,460 |
| 2017 | $1,563 | $34,860 | $7,400 | $27,460 |
| 2016 | $1,563 | $34,860 | $7,400 | $27,460 |
| 2015 | $1,824 | $29,520 | $8,100 | $21,420 |
| 2014 | $1,474 | $29,520 | $8,100 | $21,420 |
Source: Public Records
Map
Nearby Homes
- 1110 NW 7th St
- 312 NW J St
- 315 NW O St
- 703 NW J St
- 411 NW Saddlebrook Dr
- 701 NW Ford Ln
- 0 NW Olinka Pass St
- 1002 NW 9th St
- 1201 NW 10th St
- 912 NW 9th St
- 103 NW J St
- 1004 Robin Haven Dr
- 3631 Bitterroot Cove
- 214 El Contento Dr
- 1402 NW 11th St
- Lot 8 NW H St
- Lot 7 NW H St
- Lot 7 & 8 NW H St
- 823 NW 8th St
- 827 NW 8th St
- 409 Grist Mill
- 411 Grist Mill
- 411 Gristmill
- 407 Gristmill
- 505 Old Forge Dr
- 405 Grist Mill
- 405 Gristmill
- 408 Gristmill
- 408 Grist Mill
- 501 Old Forge Dr
- 406 Gristmill
- 406 Grist Mill
- 507 Old Forge Dr
- 510 Old Forge Dr
- 404 Gristmill
- 404 Grist Mill
- 512 Old Forge Dr
- 506 Old Forge Dr
- 409 Old Forge Dr
- 514 Old Forge Dr