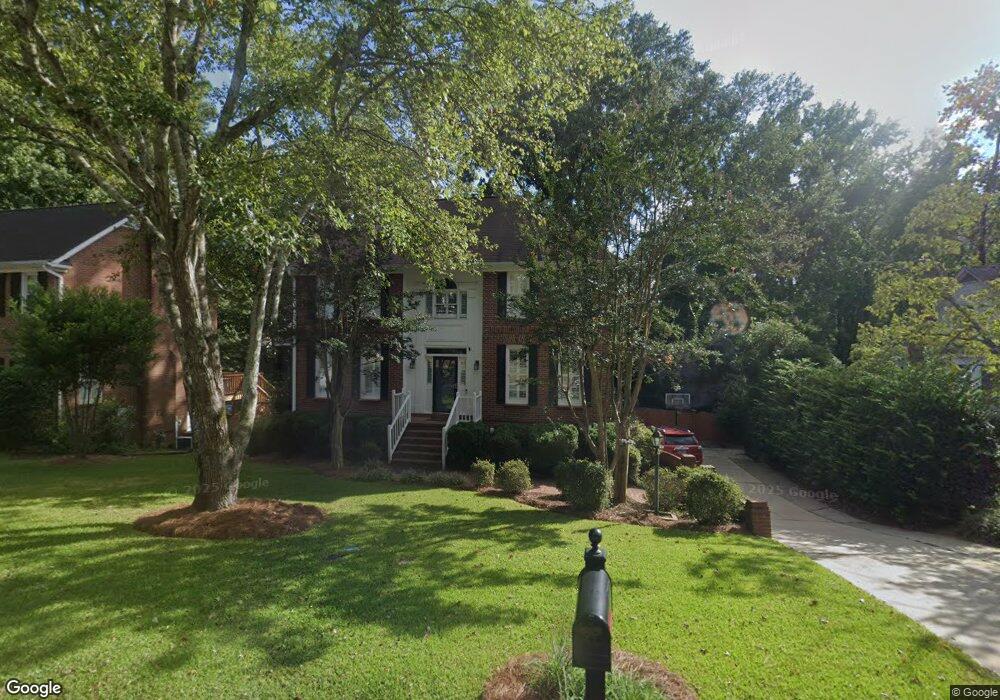
409 Hampton Trace Ln Columbia, SC 29209
The Hamptons NeighborhoodEstimated Value: $466,731 - $516,000
3
Beds
3
Baths
2,370
Sq Ft
$206/Sq Ft
Est. Value
About This Home
This home is located at 409 Hampton Trace Ln, Columbia, SC 29209 and is currently estimated at $487,933, approximately $205 per square foot. 409 Hampton Trace Ln is a home located in Richland County with nearby schools including Meadowfield Elementary School, Hand Middle School, and Dreher High School.
Ownership History
Date
Name
Owned For
Owner Type
Purchase Details
Closed on
Dec 19, 2017
Sold by
Burroughs Christa Fisher and Burroughs Charles Homer
Bought by
Burroughs Christa Fisher
Current Estimated Value
Purchase Details
Closed on
May 17, 2012
Sold by
Dong Dennis E and Dong Linda A
Bought by
Bartley Robert E and Bartley Jessica M
Home Financials for this Owner
Home Financials are based on the most recent Mortgage that was taken out on this home.
Original Mortgage
$266,000
Interest Rate
4.01%
Mortgage Type
New Conventional
Purchase Details
Closed on
Aug 29, 2002
Sold by
Worsham Phillip B and Worsham Courtney R
Bought by
Dong Dennis F and Dong Linda A
Purchase Details
Closed on
Oct 1, 1999
Sold by
Morrison Harvey E and Morrison Suzanne L
Bought by
Worsham Philip B and Worsham Courtney R
Home Financials for this Owner
Home Financials are based on the most recent Mortgage that was taken out on this home.
Original Mortgage
$193,500
Interest Rate
7.37%
Create a Home Valuation Report for This Property
The Home Valuation Report is an in-depth analysis detailing your home's value as well as a comparison with similar homes in the area
Home Values in the Area
Average Home Value in this Area
Purchase History
| Date | Buyer | Sale Price | Title Company |
|---|---|---|---|
| Burroughs Christa Fisher | -- | None Available | |
| Bartley Robert E | $280,000 | None Available | |
| Dong Dennis F | $245,000 | -- | |
| Worsham Philip B | $215,000 | -- |
Source: Public Records
Mortgage History
| Date | Status | Borrower | Loan Amount |
|---|---|---|---|
| Previous Owner | Bartley Robert E | $266,000 | |
| Previous Owner | Worsham Philip B | $193,500 |
Source: Public Records
Tax History
| Year | Tax Paid | Tax Assessment Tax Assessment Total Assessment is a certain percentage of the fair market value that is determined by local assessors to be the total taxable value of land and additions on the property. | Land | Improvement |
|---|---|---|---|---|
| 2024 | $2,530 | $353,800 | $0 | $0 |
| 2023 | $2,440 | $12,304 | $0 | $0 |
| 2022 | $2,230 | $307,600 | $47,700 | $259,900 |
| 2021 | $2,373 | $12,100 | $0 | $0 |
| 2020 | $2,418 | $12,100 | $0 | $0 |
| 2019 | $2,410 | $12,100 | $0 | $0 |
| 2018 | $2,263 | $11,200 | $0 | $0 |
| 2017 | $2,206 | $11,200 | $0 | $0 |
| 2016 | $2,196 | $11,200 | $0 | $0 |
| 2015 | $2,129 | $11,200 | $0 | $0 |
| 2014 | $2,056 | $280,000 | $0 | $0 |
| 2013 | -- | $11,200 | $0 | $0 |
Source: Public Records
Map
Nearby Homes
- 2 Copperfield Ct
- 604 Hampton Trace Ln
- 11 Copperfield Ct
- 5950 Hampton Leas Ln
- 549 Old Woodlands Rd
- 1 Thames Ct
- 6125 Hampton Ridge Rd
- 6427 Christie Rd
- 110 Wembley St
- 6131 Moss Springs Rd
- 6524 Merrill Rd
- 5 Kensington Place
- 5911 Marthas Glen Rd
- 6627 Christie Rd
- 126 Cardiff St
- 6525 Macon Rd
- 165 Preserve Ln
- 1801 Tall Pines Cir
- 420 Chambly Dr
- 1511 Tall Pines Cir
- 405 Hampton Trace Ln
- 413 Hampton Trace Ln
- 300 Dean Hall Ln
- 410 Hampton Trace Ln
- 304 Dean Hall Ln
- 417 Hampton Trace Ln
- 10 Rosebank Ct
- 404 Hampton Trace Ln
- 414 Hampton Trace Ln
- 308 Dean Hall Ln
- 400 Hampton Trace Ln
- 12 Rosebank Ct
- 418 Hampton Trace Ln
- 425 Hampton Trace Ln
- 312 Dean Hall Ln
- 8 Rosebank Ct
- 6106 Hampton Leas Ln
- 437 Hampton Trace Ln
- 6104 Hampton Leas Ln
- 301 Dean Hall Ln
Your Personal Tour Guide
Ask me questions while you tour the home.