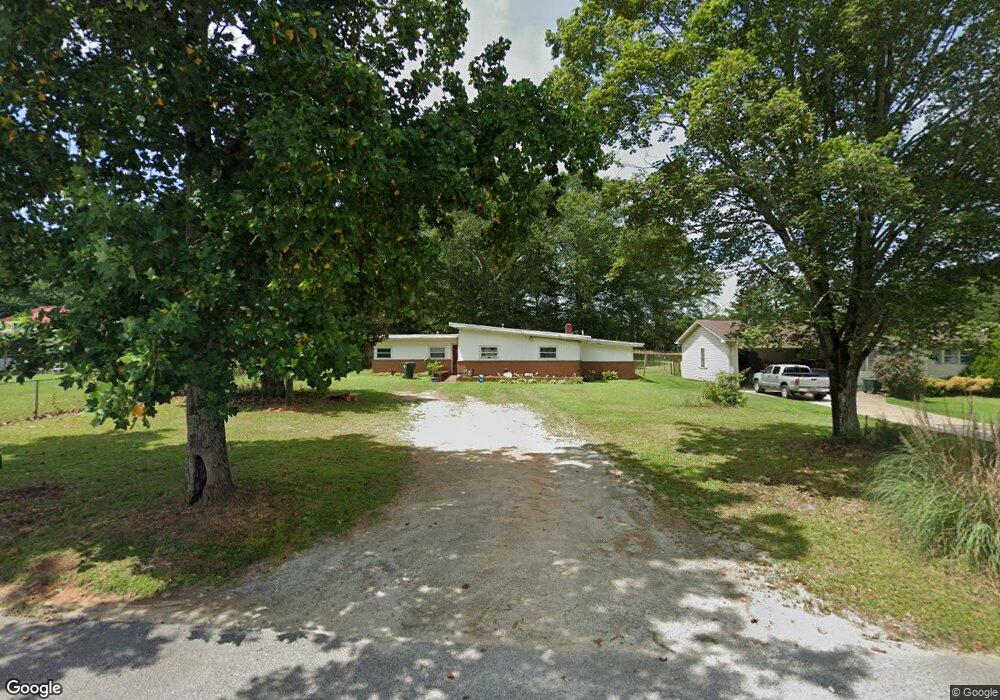
409 Hickory Dr Elberton, GA 30635
Estimated Value: $153,341 - $194,000
--
Bed
2
Baths
1,838
Sq Ft
$96/Sq Ft
Est. Value
About This Home
This home is located at 409 Hickory Dr, Elberton, GA 30635 and is currently estimated at $176,085, approximately $95 per square foot. 409 Hickory Dr is a home located in Elbert County with nearby schools including Elbert County Elementary School, Elbert County Primary School, and Elbert County Middle School.
Ownership History
Date
Name
Owned For
Owner Type
Purchase Details
Closed on
Sep 20, 2013
Sold by
Hill Brenda
Bought by
Mize Property Holdings Ii Llc
Current Estimated Value
Purchase Details
Closed on
Dec 6, 2006
Sold by
Mize Property Holdings Ii
Bought by
Hill Brenda and Hill Whitaker Keith
Home Financials for this Owner
Home Financials are based on the most recent Mortgage that was taken out on this home.
Original Mortgage
$60,663
Interest Rate
6.31%
Purchase Details
Closed on
Apr 14, 2005
Sold by
Mize Jimmy
Bought by
Mize Property Holdings Ii Llc
Purchase Details
Closed on
May 14, 2004
Sold by
Barnes Timothy & Cyn 0
Bought by
Mize Jimmy
Purchase Details
Closed on
Oct 26, 1999
Sold by
Mize Jimmy
Bought by
Barnes Timothy and Barnes Cyn
Purchase Details
Closed on
Jun 1, 1998
Purchase Details
Closed on
Dec 1, 1997
Purchase Details
Closed on
Sep 1, 1994
Purchase Details
Closed on
May 1, 1976
Create a Home Valuation Report for This Property
The Home Valuation Report is an in-depth analysis detailing your home's value as well as a comparison with similar homes in the area
Home Values in the Area
Average Home Value in this Area
Purchase History
| Date | Buyer | Sale Price | Title Company |
|---|---|---|---|
| Mize Property Holdings Ii Llc | -- | -- | |
| Hill Brenda | $62,000 | -- | |
| Mize Property Holdings Ii Llc | -- | -- | |
| Mize Jimmy | -- | -- | |
| Barnes Timothy | $41,900 | -- | |
| -- | -- | -- | |
| -- | -- | -- | |
| -- | $28,800 | -- | |
| -- | $14,500 | -- |
Source: Public Records
Mortgage History
| Date | Status | Borrower | Loan Amount |
|---|---|---|---|
| Previous Owner | Hill Brenda | $60,663 |
Source: Public Records
Tax History Compared to Growth
Tax History
| Year | Tax Paid | Tax Assessment Tax Assessment Total Assessment is a certain percentage of the fair market value that is determined by local assessors to be the total taxable value of land and additions on the property. | Land | Improvement |
|---|---|---|---|---|
| 2024 | $1,252 | $52,879 | $3,679 | $49,200 |
| 2023 | $809 | $52,878 | $3,679 | $49,200 |
| 2022 | $642 | $28,102 | $3,679 | $24,423 |
| 2021 | $647 | $28,102 | $3,679 | $24,423 |
| 2020 | $572 | $22,747 | $4,088 | $18,659 |
| 2019 | $591 | $22,747 | $4,088 | $18,659 |
| 2018 | $704 | $26,202 | $4,088 | $22,114 |
| 2017 | $722 | $22,990 | $4,088 | $18,902 |
| 2016 | $675 | $22,990 | $4,088 | $18,902 |
| 2015 | -- | $22,990 | $4,088 | $18,902 |
| 2014 | -- | $22,990 | $4,088 | $18,902 |
| 2013 | -- | $22,990 | $4,088 | $18,902 |
Source: Public Records
Map
Nearby Homes
- 1020 Hickory Dr
- 0 Sara Jane Dr Unit 10501253
- 345 N Oliver St
- 346 N Oliver St
- 243 W Tate St
- 44 Clairmont Ave
- 1315 Pine Hill Dr
- 1133 Kathwood Dr
- 1102 Williams Ln
- 0 Pulliam St Unit 7659662
- 0 Pulliam St Unit 10616872
- 89 College Ave
- 1061 Porter Dr
- 968 Ext Elbert St
- 381 College Ave
- 136 Forest Ave
- 62 Oak St
- 214 Campbell St
- 105 S Thomas St
- 108 Brookhaven Cir
- 411 Hickory Dr
- 407 Hickory Dr
- 413 Hickory Dr
- 435 Elm St
- 437 Elm St
- 404 Hickory Dr
- 433 Elm St
- 408 Hickory Dr
- 0 Hickory Dr Unit 8871169
- 0 Hickory Dr Unit 8343702
- 0 Hickory Dr Unit 7464987
- 0 Hickory Dr
- 431 Elm St
- 410 Hickory Dr
- 443 Elm St
- 1024 Hickory Dr
- 425 Elm St
- 447 Elm St
- 1032 Hickory Dr
- 436 Elm St