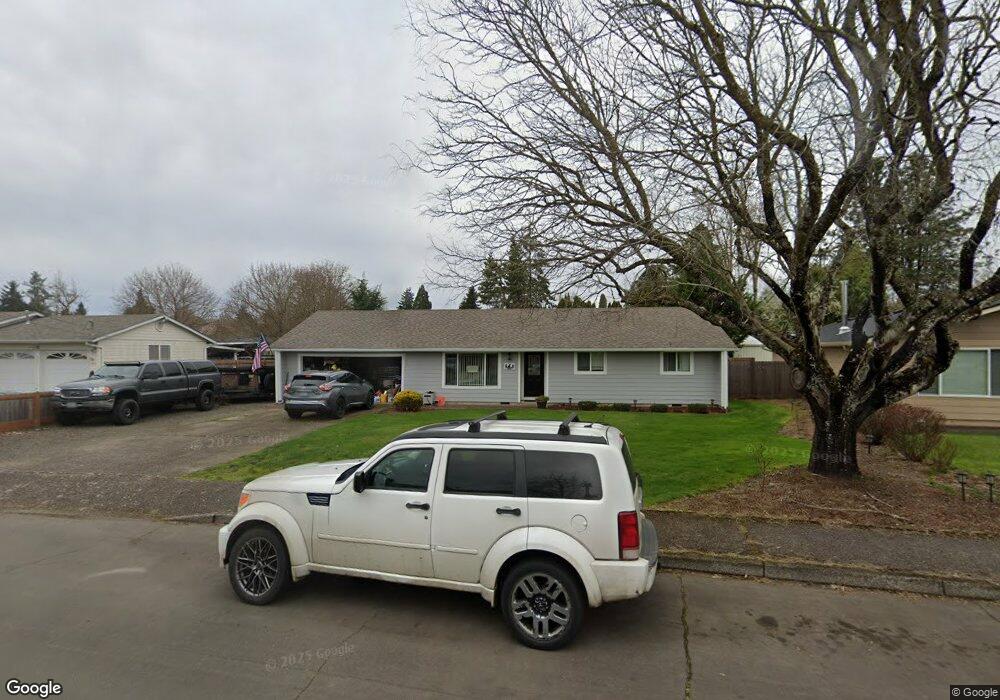
409 High St Jefferson, OR 97352
Estimated Value: $351,000 - $390,000
3
Beds
2
Baths
1,282
Sq Ft
$294/Sq Ft
Est. Value
About This Home
This home is located at 409 High St, Jefferson, OR 97352 and is currently estimated at $376,635, approximately $293 per square foot. 409 High St is a home located in Marion County with nearby schools including Jefferson Elementary School, Jefferson Middle School, and Jefferson High School.
Ownership History
Date
Name
Owned For
Owner Type
Purchase Details
Closed on
Jul 27, 2006
Sold by
Briley Brandy L
Bought by
Fountain Brian J and Fountain Stacy L
Current Estimated Value
Home Financials for this Owner
Home Financials are based on the most recent Mortgage that was taken out on this home.
Original Mortgage
$127,848
Outstanding Balance
$75,164
Interest Rate
6.57%
Mortgage Type
FHA
Estimated Equity
$301,471
Purchase Details
Closed on
Jul 6, 2006
Sold by
Briley Richard A
Bought by
Briley Brandy L
Home Financials for this Owner
Home Financials are based on the most recent Mortgage that was taken out on this home.
Original Mortgage
$127,848
Outstanding Balance
$75,164
Interest Rate
6.57%
Mortgage Type
FHA
Estimated Equity
$301,471
Purchase Details
Closed on
Mar 31, 2006
Sold by
Briley Richard A
Bought by
Briley Brandy L
Create a Home Valuation Report for This Property
The Home Valuation Report is an in-depth analysis detailing your home's value as well as a comparison with similar homes in the area
Home Values in the Area
Average Home Value in this Area
Purchase History
| Date | Buyer | Sale Price | Title Company |
|---|---|---|---|
| Fountain Brian J | $129,854 | Ticor Title | |
| Briley Brandy L | -- | Ticor Title | |
| Briley Brandy L | -- | Accommodation |
Source: Public Records
Mortgage History
| Date | Status | Borrower | Loan Amount |
|---|---|---|---|
| Open | Fountain Brian J | $127,848 |
Source: Public Records
Tax History
| Year | Tax Paid | Tax Assessment Tax Assessment Total Assessment is a certain percentage of the fair market value that is determined by local assessors to be the total taxable value of land and additions on the property. | Land | Improvement |
|---|---|---|---|---|
| 2025 | $2,482 | $169,470 | -- | -- |
| 2024 | $2,482 | $164,540 | -- | -- |
| 2023 | $2,341 | $159,750 | $0 | $0 |
| 2022 | $2,204 | $155,100 | $0 | $0 |
| 2021 | $2,137 | $150,590 | $0 | $0 |
| 2020 | $2,076 | $146,210 | $0 | $0 |
| 2019 | $2,026 | $141,960 | $0 | $0 |
| 2018 | $1,994 | $0 | $0 | $0 |
| 2017 | $1,931 | $0 | $0 | $0 |
| 2016 | $1,687 | $0 | $0 | $0 |
| 2015 | $1,641 | $0 | $0 | $0 |
| 2014 | $1,573 | $0 | $0 | $0 |
Source: Public Records
Map
Nearby Homes
- 430 Oakdale Ct
- 773 S Grice Loop
- 160 Tanglewood Dr Unit 164
- 634 S Sunrise Dr
- 137 Tanglewood (-141) Dr
- 184 Greenwood Dr
- 219 Columbia St
- 554 S Main St
- 752 S Sunrise Dr
- 758 S Sunrise Dr
- 0 Lot Union St
- LOT Union St
- 205 N 3rd St
- 271 N 3rd St
- 257 N 6th St
- 0 Harris Ln SE
- 329 Church St
- 941 N 2nd St
- Lot 200 Bates St
- 34388 Grenz Ln NE
Your Personal Tour Guide
Ask me questions while you tour the home.