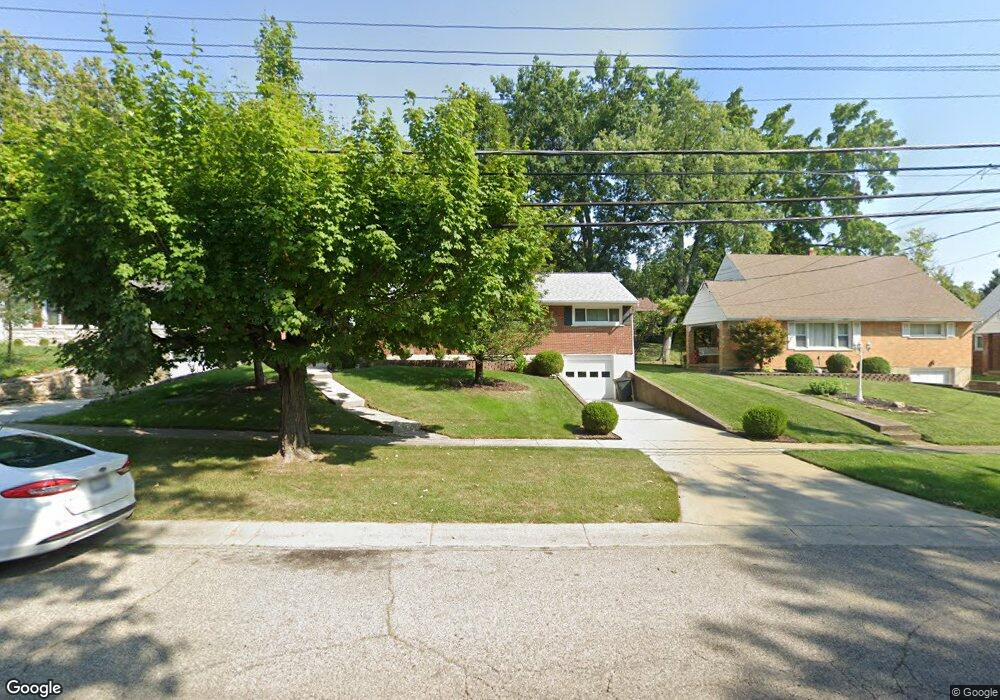
409 Ingram Rd Cincinnati, OH 45218
Estimated Value: $198,000 - $235,000
3
Beds
1
Bath
1,222
Sq Ft
$172/Sq Ft
Est. Value
About This Home
This home is located at 409 Ingram Rd, Cincinnati, OH 45218 and is currently estimated at $209,923, approximately $171 per square foot. 409 Ingram Rd is a home located in Hamilton County with nearby schools including Central Montessori Academy.
Ownership History
Date
Name
Owned For
Owner Type
Purchase Details
Closed on
Feb 29, 1996
Sold by
Buxton Rodney C and Buxton Janet L
Bought by
Gregg Charles and Gregg Nancy
Current Estimated Value
Home Financials for this Owner
Home Financials are based on the most recent Mortgage that was taken out on this home.
Original Mortgage
$79,652
Interest Rate
7.06%
Mortgage Type
FHA
Create a Home Valuation Report for This Property
The Home Valuation Report is an in-depth analysis detailing your home's value as well as a comparison with similar homes in the area
Home Values in the Area
Average Home Value in this Area
Purchase History
We collect this data history from publicly available records. To have your information removed, we recommend requesting removal directly through your county’s website.
| Date | Buyer | Sale Price | Title Company |
|---|---|---|---|
| Gregg Charles | -- | Midland Title Security Inc |
Source: Public Records
Mortgage History
We collect this data history from publicly available records. To have your information removed, we recommend requesting removal directly through your county’s website.
| Date | Status | Borrower | Loan Amount |
|---|---|---|---|
| Previous Owner | Gregg Charles | $79,652 |
Source: Public Records
Tax History
| Year | Tax Paid | Tax Assessment Tax Assessment Total Assessment is a certain percentage of the fair market value that is determined by local assessors to be the total taxable value of land and additions on the property. | Land | Improvement |
|---|---|---|---|---|
| 2025 | $3,014 | $51,573 | $9,877 | $41,696 |
| 2024 | $2,786 | $51,573 | $9,877 | $41,696 |
| 2023 | $2,640 | $51,573 | $9,877 | $41,696 |
| 2022 | $2,080 | $33,639 | $7,662 | $25,977 |
| 2021 | $2,022 | $33,639 | $7,662 | $25,977 |
| 2020 | $2,071 | $33,639 | $7,662 | $25,977 |
| 2019 | $1,890 | $28,753 | $6,549 | $22,204 |
| 2018 | $1,894 | $28,753 | $6,549 | $22,204 |
| 2017 | $1,746 | $28,753 | $6,549 | $22,204 |
| 2016 | $1,965 | $30,856 | $7,077 | $23,779 |
| 2015 | $1,856 | $30,856 | $7,077 | $23,779 |
| 2014 | $1,901 | $30,856 | $7,077 | $23,779 |
| 2013 | $2,069 | $33,541 | $7,693 | $25,848 |
Source: Public Records
Map
Nearby Homes
Your Personal Tour Guide
Ask me questions while you tour the home.