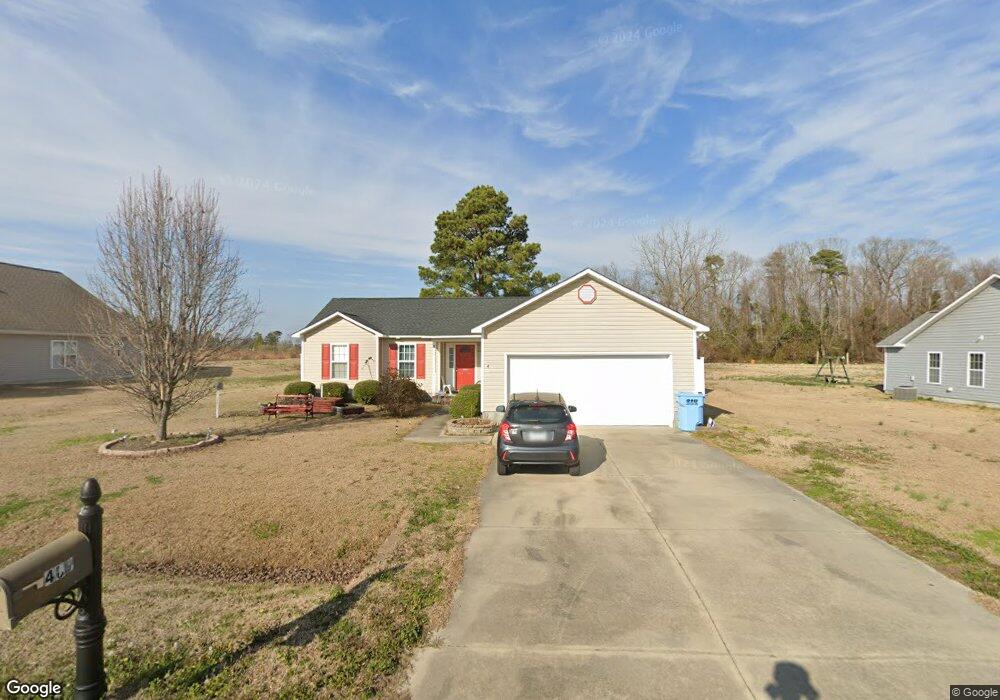
409 Jessica Ct Richlands, NC 28574
Estimated Value: $237,000 - $250,098
3
Beds
2
Baths
1,150
Sq Ft
$211/Sq Ft
Est. Value
About This Home
This home is located at 409 Jessica Ct, Richlands, NC 28574 and is currently estimated at $242,275, approximately $210 per square foot. 409 Jessica Ct is a home with nearby schools including Richlands Elementary School, Trexler Middle School, and Richlands High School.
Ownership History
Date
Name
Owned For
Owner Type
Purchase Details
Closed on
Aug 30, 2010
Sold by
A Sydes Construction Inc
Bought by
Duross Bradford W and Duross Doris M
Current Estimated Value
Purchase Details
Closed on
Mar 30, 2010
Sold by
Baysden Danny E and Baysden Wanda K
Bought by
A Sydes Construction Inc
Home Financials for this Owner
Home Financials are based on the most recent Mortgage that was taken out on this home.
Original Mortgage
$216,750
Interest Rate
4.91%
Mortgage Type
Purchase Money Mortgage
Create a Home Valuation Report for This Property
The Home Valuation Report is an in-depth analysis detailing your home's value as well as a comparison with similar homes in the area
Home Values in the Area
Average Home Value in this Area
Purchase History
| Date | Buyer | Sale Price | Title Company |
|---|---|---|---|
| Duross Bradford W | $144,000 | None Available | |
| A Sydes Construction Inc | $56,000 | None Available |
Source: Public Records
Mortgage History
| Date | Status | Borrower | Loan Amount |
|---|---|---|---|
| Previous Owner | A Sydes Construction Inc | $216,750 |
Source: Public Records
Tax History Compared to Growth
Tax History
| Year | Tax Paid | Tax Assessment Tax Assessment Total Assessment is a certain percentage of the fair market value that is determined by local assessors to be the total taxable value of land and additions on the property. | Land | Improvement |
|---|---|---|---|---|
| 2025 | $1,190 | $181,614 | $40,000 | $141,614 |
| 2024 | $1,190 | $181,614 | $40,000 | $141,614 |
| 2023 | $1,190 | $181,614 | $40,000 | $141,614 |
| 2022 | $1,190 | $181,614 | $40,000 | $141,614 |
| 2021 | $891 | $126,400 | $25,000 | $101,400 |
| 2020 | $882 | $125,070 | $25,000 | $100,070 |
| 2019 | $882 | $125,070 | $25,000 | $100,070 |
| 2018 | $882 | $125,070 | $25,000 | $100,070 |
| 2017 | $841 | $124,530 | $31,000 | $93,530 |
| 2016 | $841 | $124,530 | $0 | $0 |
| 2015 | $834 | $123,560 | $0 | $0 |
| 2014 | $834 | $123,560 | $0 | $0 |
Source: Public Records
Map
Nearby Homes
- 105 Dole Ct
- 100 Dole Ct
- 102 Dole Ct
- 315 Haywood Dr
- 293 Haywood Dr
- 297 Haywood Dr
- 253 Deer Haven Dr
- 255 Deer Haven Dr
- 418 Wade Dr
- 416 Wade Dr
- 410 Wade Dr
- 400 Wade Dr
- 402 Wade Dr
- 414 Wade Dr
- 412 Wade Dr
- 404 Silva Cove
- 170 Cavanaughtown Rd
- GALEN Plan at Driftwood
- MANNING Plan at Driftwood
- KERRY Plan at Driftwood