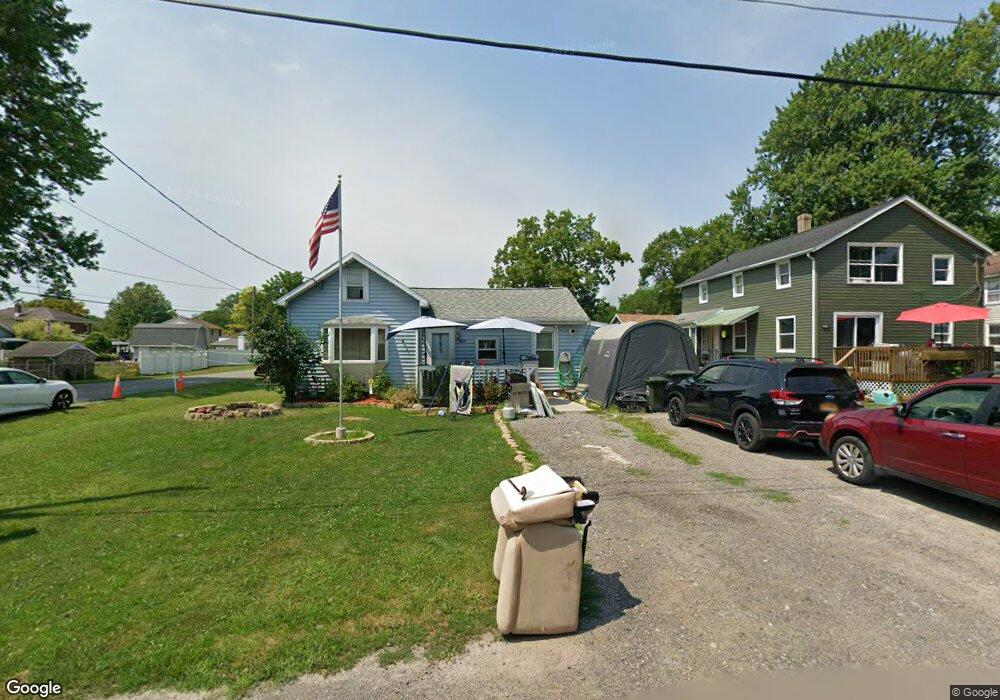
409 Kohl St North Tonawanda, NY 14120
Estimated Value: $87,000 - $187,000
3
Beds
1
Bath
670
Sq Ft
$202/Sq Ft
Est. Value
About This Home
This home is located at 409 Kohl St, North Tonawanda, NY 14120 and is currently estimated at $135,644, approximately $202 per square foot. 409 Kohl St is a home located in Niagara County with nearby schools including Drake School, St Matthew Lutheran School, and St. John Lutheran School.
Ownership History
Date
Name
Owned For
Owner Type
Purchase Details
Closed on
Jun 30, 2011
Sold by
Spencer Floyd W and Spencer Raymond L
Bought by
Spencer Clyde R
Current Estimated Value
Home Financials for this Owner
Home Financials are based on the most recent Mortgage that was taken out on this home.
Original Mortgage
$27,000
Interest Rate
4.33%
Mortgage Type
Seller Take Back
Purchase Details
Closed on
Feb 20, 2009
Sold by
Wells Fargo Financial Credit S
Bought by
Spencer Raymond
Purchase Details
Closed on
Oct 16, 2008
Sold by
Veach Marilyn
Bought by
Wells Fargo Financial Credit S
Create a Home Valuation Report for This Property
The Home Valuation Report is an in-depth analysis detailing your home's value as well as a comparison with similar homes in the area
Home Values in the Area
Average Home Value in this Area
Purchase History
| Date | Buyer | Sale Price | Title Company |
|---|---|---|---|
| Spencer Clyde R | $27,000 | None Available | |
| Spencer Raymond | $7,500 | John Wiesner | |
| Wells Fargo Financial Credit S | $30,000 | Steven Baum |
Source: Public Records
Mortgage History
| Date | Status | Borrower | Loan Amount |
|---|---|---|---|
| Closed | Spencer Clyde R | $27,000 |
Source: Public Records
Tax History Compared to Growth
Tax History
| Year | Tax Paid | Tax Assessment Tax Assessment Total Assessment is a certain percentage of the fair market value that is determined by local assessors to be the total taxable value of land and additions on the property. | Land | Improvement |
|---|---|---|---|---|
| 2024 | $1,412 | $40,000 | $12,300 | $27,700 |
| 2023 | $1,377 | $40,000 | $12,300 | $27,700 |
| 2022 | $853 | $40,000 | $12,300 | $27,700 |
| 2021 | $821 | $40,000 | $12,300 | $27,700 |
| 2020 | $702 | $40,000 | $12,300 | $27,700 |
| 2019 | $343 | $40,000 | $12,300 | $27,700 |
| 2018 | $616 | $40,000 | $12,300 | $27,700 |
| 2017 | $553 | $40,000 | $12,300 | $27,700 |
| 2016 | $463 | $40,000 | $12,300 | $27,700 |
| 2015 | -- | $40,000 | $12,300 | $27,700 |
| 2014 | -- | $16,000 | $12,300 | $3,700 |
Source: Public Records
Map
Nearby Homes