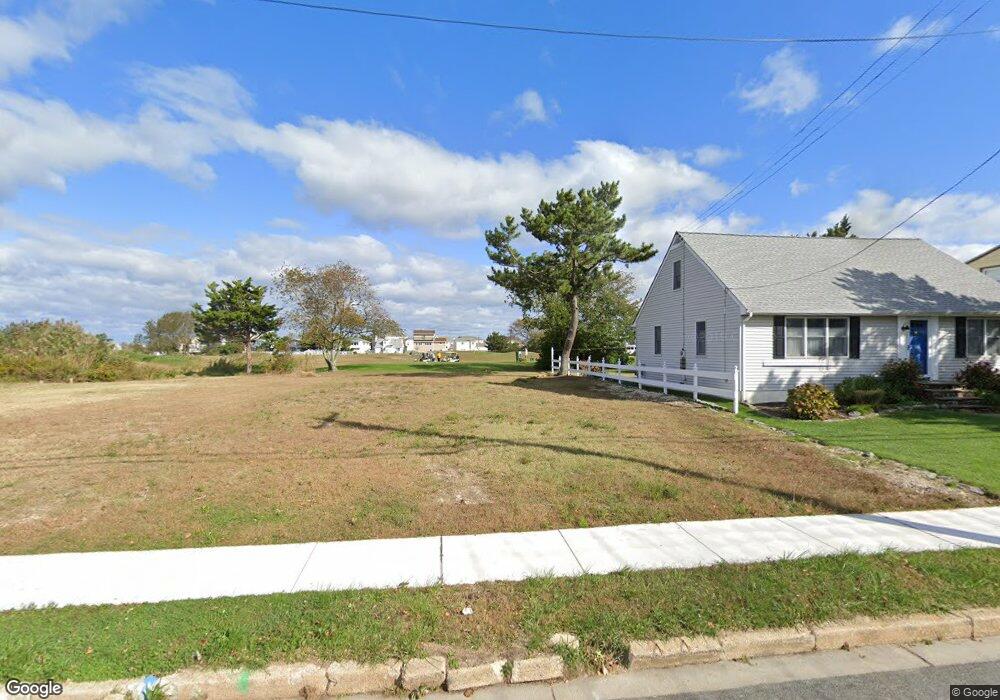
409 Lafayette Blvd Brigantine, NJ 08203
Estimated Value: $434,000
Studio
--
Bath
2,044
Sq Ft
$212/Sq Ft
Est. Value
About This Home
This home is located at 409 Lafayette Blvd, Brigantine, NJ 08203 and is currently estimated at $434,000, approximately $212 per square foot. 409 Lafayette Blvd is a home located in Atlantic County with nearby schools including Brigantine Elementary School.
Ownership History
Date
Name
Owned For
Owner Type
Purchase Details
Closed on
Mar 1, 2003
Sold by
Rossetti Joseph
Bought by
Franceschini Michael and Pirri Louis
Current Estimated Value
Home Financials for this Owner
Home Financials are based on the most recent Mortgage that was taken out on this home.
Original Mortgage
$192,000
Outstanding Balance
$80,006
Interest Rate
5.95%
Mortgage Type
Purchase Money Mortgage
Estimated Equity
$353,994
Purchase Details
Closed on
May 24, 2000
Sold by
Hunt Francis K and Dailey Thomas A
Bought by
Rossetti Joseph R and Rossetti Denise I
Home Financials for this Owner
Home Financials are based on the most recent Mortgage that was taken out on this home.
Original Mortgage
$126,000
Interest Rate
8.48%
Purchase Details
Closed on
Dec 3, 1997
Sold by
Hunt Frances K and Dailey Louise Joyce
Bought by
Hunt Frances K and Dailey Thomas A
Create a Home Valuation Report for This Property
The Home Valuation Report is an in-depth analysis detailing your home's value as well as a comparison with similar homes in the area
Home Values in the Area
Average Home Value in this Area
Purchase History
| Date | Buyer | Sale Price | Title Company |
|---|---|---|---|
| Franceschini Michael | $240,000 | -- | |
| Franceschini Michael | $240,000 | Commonwealth Land Title Ins | |
| Rossetti Joseph R | $160,000 | The Title Company | |
| Hunt Frances K | -- | -- |
Source: Public Records
Mortgage History
| Date | Status | Borrower | Loan Amount |
|---|---|---|---|
| Open | Franceschini Michael | $192,000 | |
| Closed | Franceschini Michael | $192,000 | |
| Previous Owner | Rossetti Joseph R | $126,000 |
Source: Public Records
Tax History
| Year | Tax Paid | Tax Assessment Tax Assessment Total Assessment is a certain percentage of the fair market value that is determined by local assessors to be the total taxable value of land and additions on the property. | Land | Improvement |
|---|---|---|---|---|
| 2025 | $3,196 | $170,000 | $170,000 | -- |
| 2024 | $3,142 | $170,000 | $170,000 | $0 |
Source: Public Records
Map
Nearby Homes
- 116 Bayshore Ave
- 209 Bayshore Ave
- 20 Heald Rd
- 9 Cummings Place
- 29 Cummings Place
- 6th Rum Point Ct
- 305 Beach Ave W Unit A and B
- 468 W Shore Dr
- 159 Sheridan Square
- 526 Lafayette Blvd
- 150 9th St S
- 1000 Sheridan Blvd
- 218 S Roosevelt Blvd
- 313 W Brigantine Ave Unit 8
- 222 8th St S
- 202 E Brigantine Ave
- 315 E Brigantine Ave
- 713 W Brigantine Ave
- 250 8th St S
- 300 E Brigantine Ave Unit 11
- 407 Lafayette Blvd
- 405 Lafayette Blvd
- 411 Lafayette Blvd
- 413 Lafayette Blvd
- 403 Lafayette Blvd
- 408 Lafayette Blvd
- 406 Lafayette Blvd
- 410 Lafayette Blvd
- 415 Lafayette Blvd
- 303 Lafayette Blvd
- 404 Lafayette Blvd
- 118 Bayshore Ave
- 401 Lafayette Blvd
- 412 Lafayette Blvd
- 402 Lafayette Blvd
- 417 Lafayette Blvd
- 414 Lafayette Blvd
- 114 Bayshore Ave
- 400 Lafayette Blvd
- 409 W Shore Dr
Your Personal Tour Guide
Ask me questions while you tour the home.