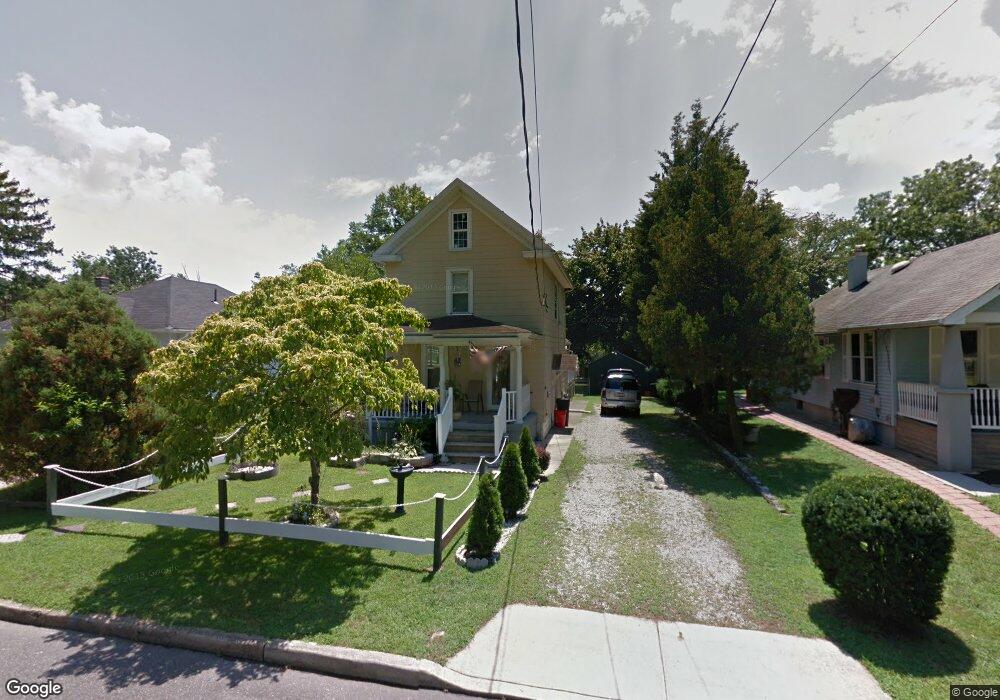
409 Lafrance St Vineland, NJ 08360
Estimated Value: $192,000 - $255,000
3
Beds
1
Bath
1,092
Sq Ft
$211/Sq Ft
Est. Value
About This Home
This home is located at 409 Lafrance St, Vineland, NJ 08360 and is currently estimated at $230,614, approximately $211 per square foot. 409 Lafrance St is a home located in Cumberland County with nearby schools including Max Leuchter Elementary School, T.W. Wallace Middle School, and Vineland Senior High School.
Ownership History
Date
Name
Owned For
Owner Type
Purchase Details
Closed on
May 25, 2010
Sold by
Garda Garcia Christine L and Garda Victor M
Bought by
Hernandez Carmen
Current Estimated Value
Home Financials for this Owner
Home Financials are based on the most recent Mortgage that was taken out on this home.
Original Mortgage
$93,737
Outstanding Balance
$64,196
Interest Rate
5.5%
Mortgage Type
FHA
Estimated Equity
$166,418
Create a Home Valuation Report for This Property
The Home Valuation Report is an in-depth analysis detailing your home's value as well as a comparison with similar homes in the area
Home Values in the Area
Average Home Value in this Area
Purchase History
| Date | Buyer | Sale Price | Title Company |
|---|---|---|---|
| Hernandez Carmen | $95,000 | -- |
Source: Public Records
Mortgage History
| Date | Status | Borrower | Loan Amount |
|---|---|---|---|
| Open | Hernandez Carmen | $93,737 |
Source: Public Records
Tax History Compared to Growth
Tax History
| Year | Tax Paid | Tax Assessment Tax Assessment Total Assessment is a certain percentage of the fair market value that is determined by local assessors to be the total taxable value of land and additions on the property. | Land | Improvement |
|---|---|---|---|---|
| 2025 | $3,098 | $97,300 | $24,300 | $73,000 |
| 2024 | $3,098 | $97,300 | $24,300 | $73,000 |
| 2023 | $3,078 | $97,300 | $24,300 | $73,000 |
| 2022 | $2,986 | $97,300 | $24,300 | $73,000 |
| 2021 | $2,932 | $97,300 | $24,300 | $73,000 |
| 2020 | $2,848 | $97,300 | $24,300 | $73,000 |
| 2019 | $2,809 | $97,300 | $24,300 | $73,000 |
| 2018 | $2,735 | $97,300 | $24,300 | $73,000 |
| 2017 | $2,598 | $97,300 | $24,300 | $73,000 |
| 2016 | $2,506 | $97,300 | $24,300 | $73,000 |
| 2015 | $2,414 | $97,300 | $24,300 | $73,000 |
| 2014 | $2,283 | $97,300 | $24,300 | $73,000 |
Source: Public Records
Map
Nearby Homes
- 330 W Peach St
- 108 W Park Ave
- 400 N 7th St
- 636 E Pear St
- 550 Northwest Ave
- 818 E Pear St
- 732 Broadway
- 409 N East Ave
- 411 N East Ave
- 511 E Grape St
- 329 W Grape St
- 48 N Myrtle St
- 404 Montrose St
- 218 W Montrose St
- 724 E Grape St
- 708 E Montrose St Unit 710
- 818 E Grape St
- 406 S 6th St
- 739 E Montrose St
- 1298 W Cornell St