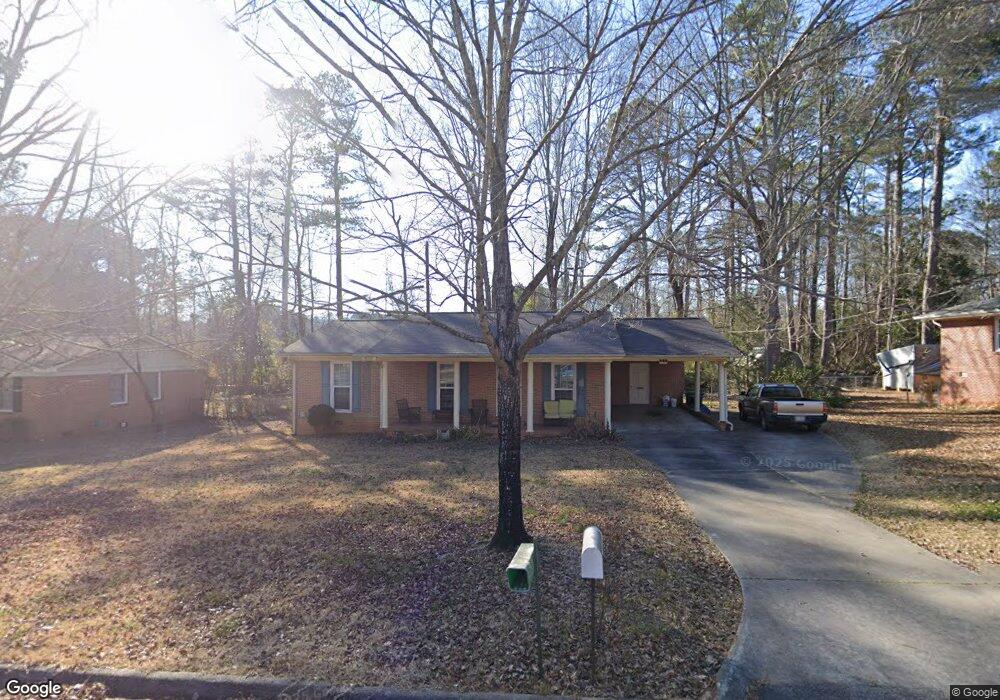
409 Leola Dr Griffin, GA 30224
Spalding County NeighborhoodEstimated Value: $173,000 - $193,000
3
Beds
2
Baths
1,189
Sq Ft
$152/Sq Ft
Est. Value
About This Home
This home is located at 409 Leola Dr, Griffin, GA 30224 and is currently estimated at $181,273, approximately $152 per square foot. 409 Leola Dr is a home located in Spalding County with nearby schools including Orrs Elementary School, Carver Road Middle School, and Griffin High School.
Ownership History
Date
Name
Owned For
Owner Type
Purchase Details
Closed on
Oct 27, 2011
Sold by
Federal Home Loan Mortgage Corporation
Bought by
Mathis David W and Mathis Virginia R
Current Estimated Value
Home Financials for this Owner
Home Financials are based on the most recent Mortgage that was taken out on this home.
Original Mortgage
$36,144
Outstanding Balance
$24,730
Interest Rate
4.09%
Mortgage Type
New Conventional
Estimated Equity
$156,543
Purchase Details
Closed on
Jul 5, 2011
Sold by
United Bk
Bought by
Federal Home Loan Mortgage Corporation
Purchase Details
Closed on
Jun 19, 1992
Sold by
Moore William P
Bought by
Moore Mary Ruth L
Purchase Details
Closed on
Sep 8, 1976
Sold by
Gaylor Emmett G and Gaylor Lillian M
Bought by
Moore William P
Purchase Details
Closed on
Apr 30, 1974
Sold by
Thurston Benjamin A
Bought by
Gaylor Emmett G and Gaylor Lillian M
Purchase Details
Closed on
Sep 20, 1968
Sold by
Dutton Joe
Bought by
Thurston Benjamin A
Purchase Details
Closed on
Mar 3, 1966
Bought by
Dutton Joe
Create a Home Valuation Report for This Property
The Home Valuation Report is an in-depth analysis detailing your home's value as well as a comparison with similar homes in the area
Home Values in the Area
Average Home Value in this Area
Purchase History
| Date | Buyer | Sale Price | Title Company |
|---|---|---|---|
| Mathis David W | $45,180 | -- | |
| Federal Home Loan Mortgage Corporation | -- | -- | |
| United Bk | $21,967 | -- | |
| Moore Mary Ruth L | -- | -- | |
| Moore William P | $32,500 | -- | |
| Gaylor Emmett G | $16,000 | -- | |
| Thurston Benjamin A | $17,500 | -- | |
| Dutton Joe | -- | -- |
Source: Public Records
Mortgage History
| Date | Status | Borrower | Loan Amount |
|---|---|---|---|
| Open | Mathis David W | $36,144 |
Source: Public Records
Tax History Compared to Growth
Tax History
| Year | Tax Paid | Tax Assessment Tax Assessment Total Assessment is a certain percentage of the fair market value that is determined by local assessors to be the total taxable value of land and additions on the property. | Land | Improvement |
|---|---|---|---|---|
| 2024 | $1,862 | $48,756 | $8,800 | $39,956 |
| 2023 | $1,862 | $48,756 | $8,800 | $39,956 |
| 2022 | $1,671 | $41,816 | $7,040 | $34,776 |
| 2021 | $1,267 | $31,714 | $7,040 | $24,674 |
| 2020 | $1,112 | $27,824 | $7,040 | $20,784 |
| 2019 | $1,132 | $27,824 | $7,040 | $20,784 |
| 2018 | $1,095 | $25,914 | $7,040 | $18,874 |
| 2017 | $976 | $23,600 | $7,040 | $16,560 |
| 2016 | $894 | $21,286 | $7,040 | $14,246 |
| 2015 | $909 | $21,286 | $7,040 | $14,246 |
| 2014 | $936 | $21,286 | $7,040 | $14,246 |
Source: Public Records
Map
Nearby Homes
- 1611 Piedmont Rd
- 1663 Piedmont Rd
- 450 Carver
- 1169 W Poplar St
- 203 Ashley Dr
- 1740 Summerwoods Ln
- 424 S Pine Hill Rd Unit 1
- 117 Mixon St
- 1723 Carrington Dr
- 1721 Carrington Dr
- 1707 Carrington Dr
- 1705 Carrington Dr
- TRACT A Newnan Rd
- 1850 Carrington Dr
- 1326 Oakdale Dr
- 711 S Pine Hill Rd
- 733 S Pine Hill Rd
- 450 Carver Rd
- 1610 Williamson Rd
- 1228-1328 Edgewood Ave
- 407 Leola Dr
- 411 Leola Dr
- 410 Leola Dr
- 405 Leola Dr
- 412 Leola Dr
- 408 Leola Dr
- 413 Leola Dr
- 414 Leola Dr
- 406 Leola Dr
- 415 Leola Dr
- 404 Leola Dr
- 401 Leola Dr
- 416 Leola Dr
- 0 Leola Dr Unit 8604173
- 0 Leola Dr Unit 7312636
- 0 Leola Dr Unit 7513019
- 0 Leola Dr Unit 7354324
- 0 Leola Dr Unit 3074513
- 0 Leola Dr
- 1642 Piedmont Rd