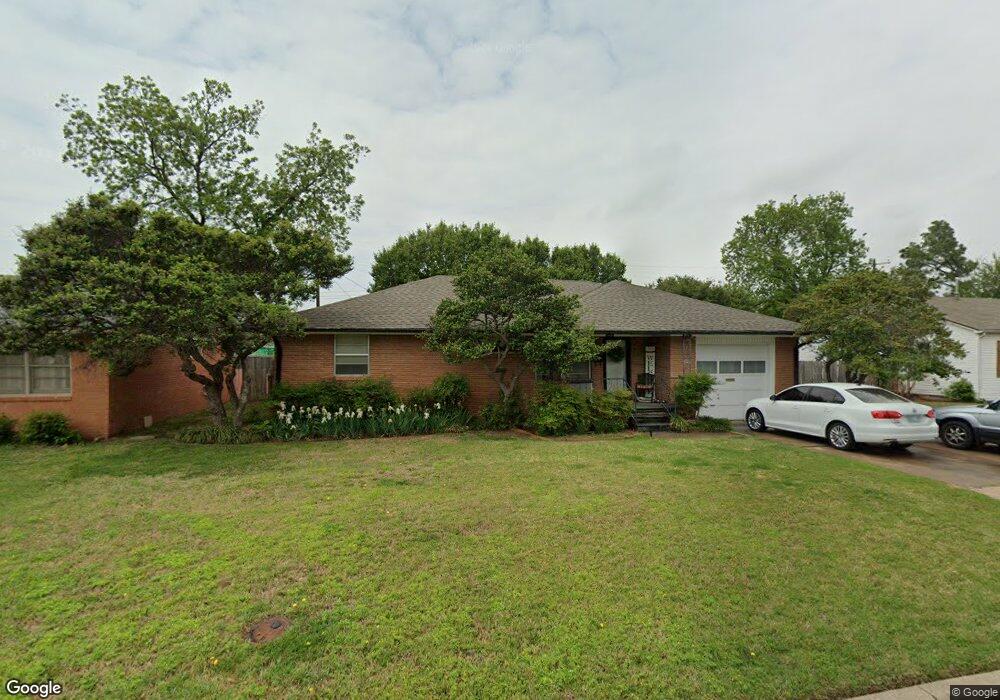
409 Lester Blvd Duncan, OK 73533
Estimated Value: $118,000 - $131,000
2
Beds
2
Baths
1,428
Sq Ft
$87/Sq Ft
Est. Value
About This Home
This home is located at 409 Lester Blvd, Duncan, OK 73533 and is currently estimated at $124,678, approximately $87 per square foot. 409 Lester Blvd is a home located in Stephens County with nearby schools including Horace Mann Elementary School, Duncan Middle School, and Duncan High School.
Ownership History
Date
Name
Owned For
Owner Type
Purchase Details
Closed on
Apr 27, 2015
Sold by
Newton Keith and Newton Rashell Susan
Bought by
Spurlock James Tiny and Spurlock Shiela Rae
Current Estimated Value
Purchase Details
Closed on
Apr 24, 2015
Sold by
Harvey Robert Alan and Harvey Brooke
Bought by
Spurlock James Tiny and Spurlock Shiela Rae
Purchase Details
Closed on
Aug 6, 2013
Sold by
Newton Loretta M
Bought by
Gamblin Gwyn
Purchase Details
Closed on
Feb 25, 2011
Sold by
Newstor Loura M
Bought by
Newstor Loura M
Purchase Details
Closed on
Jul 25, 2008
Sold by
Newton Loretta M and Harvey Gaylynn
Bought by
Newton Loretta M and Harvey Robert Alan
Purchase Details
Closed on
Apr 29, 2004
Sold by
Newton Loretta M Etal
Purchase Details
Closed on
Jan 14, 2003
Sold by
Newton Loretta M
Purchase Details
Closed on
Nov 29, 1999
Sold by
Reddell John Randal
Create a Home Valuation Report for This Property
The Home Valuation Report is an in-depth analysis detailing your home's value as well as a comparison with similar homes in the area
Home Values in the Area
Average Home Value in this Area
Purchase History
| Date | Buyer | Sale Price | Title Company |
|---|---|---|---|
| Spurlock James Tiny | $80,000 | None Available | |
| Spurlock James Tiny | -- | None Available | |
| Gamblin Gwyn | -- | -- | |
| Newstor Loura M | -- | None Available | |
| Newton Loretta M | -- | Immediate Family Title | |
| -- | -- | -- | |
| -- | -- | -- | |
| -- | $43,000 | -- |
Source: Public Records
Tax History Compared to Growth
Tax History
| Year | Tax Paid | Tax Assessment Tax Assessment Total Assessment is a certain percentage of the fair market value that is determined by local assessors to be the total taxable value of land and additions on the property. | Land | Improvement |
|---|---|---|---|---|
| 2025 | $800 | $9,857 | $882 | $8,975 |
| 2024 | $800 | $9,389 | $882 | $8,507 |
| 2023 | $800 | $9,068 | $882 | $8,186 |
| 2022 | $724 | $8,941 | $882 | $8,059 |
| 2021 | $725 | $8,516 | $882 | $7,634 |
| 2020 | $667 | $7,724 | $882 | $6,842 |
| 2019 | $653 | $7,549 | $882 | $6,667 |
| 2018 | $697 | $7,829 | $882 | $6,947 |
| 2017 | $688 | $8,005 | $882 | $7,123 |
| 2016 | $750 | $8,818 | $882 | $7,936 |
| 2015 | $218 | $4,953 | $532 | $4,421 |
| 2014 | $218 | $4,716 | $507 | $4,209 |
Source: Public Records
Map
Nearby Homes
- 2011 2011 W Oak Ave
- 2006 W Oak Ave
- 174831 N 2844 Rd
- 210 N 22nd St
- 209 N 22nd St
- 2108 Ave
- 2210 Western Dr
- 1812 W Walnut Ave
- 201 N 23rd St
- 507 N Alice Dr
- 2110 W Main St
- 2206 2206 W Spruce
- 1099 N 19th St
- 2204 W Parkview Ave
- 1309 W Beech Ave
- 2230 W Spruce St
- 812 N 15th St
- 27 N 14th St
- 1807 W Chisholm Dr
- 1929 W Chisholm Dr
- 407 Lester Blvd
- 411 Lester Blvd
- 411 411 Lester
- 410 N 20th St
- 412 N 20th St
- 408 N 20th St
- 405 Lester Blvd
- 413 Lester Blvd
- 412 Lester Blvd
- 408 Lester Blvd
- 414 N 20th St
- 406 N 20th St
- 406 Lester Blvd
- 414 Lester Blvd
- 415 Lester Blvd
- 403 Lester Blvd
- 416 N 20th St
- 404 N 20th St
- 407 N 19th St
- 416 Lester Blvd