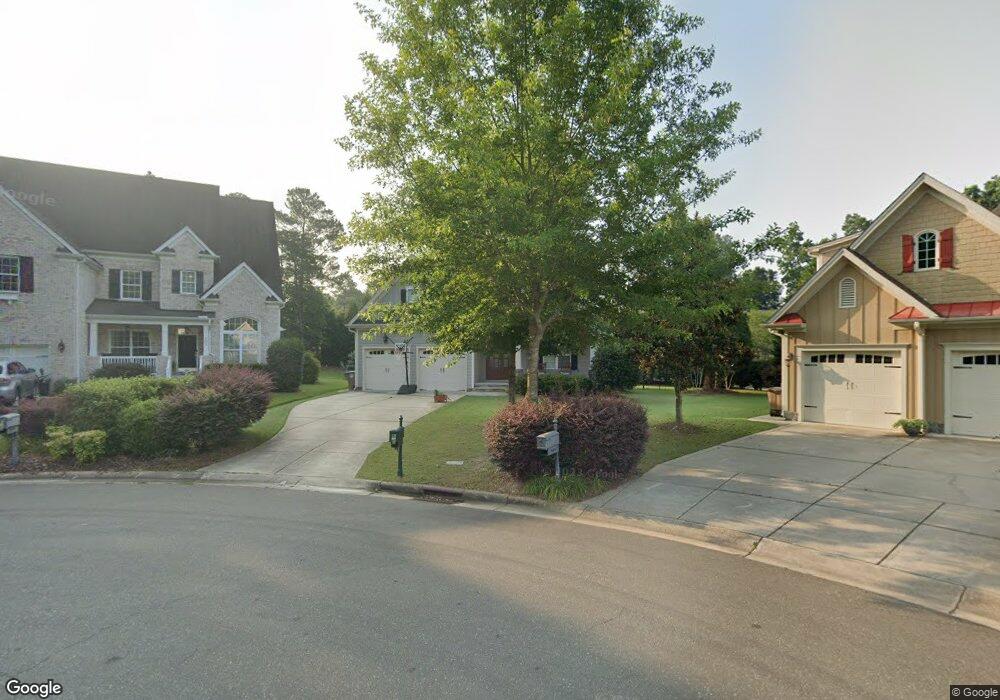
409 Longmire Point Wake Forest, NC 27587
Estimated Value: $756,292 - $872,000
5
Beds
5
Baths
3,391
Sq Ft
$246/Sq Ft
Est. Value
About This Home
This home is located at 409 Longmire Point, Wake Forest, NC 27587 and is currently estimated at $835,323, approximately $246 per square foot. 409 Longmire Point is a home located in Wake County with nearby schools including Heritage Elementary School, Heritage Middle School, and Heritage High School.
Ownership History
Date
Name
Owned For
Owner Type
Purchase Details
Closed on
Jul 19, 2013
Sold by
Mbm Builders Inc
Bought by
Christopher Timothy James and Christopher Suzanne Jennifer
Current Estimated Value
Home Financials for this Owner
Home Financials are based on the most recent Mortgage that was taken out on this home.
Original Mortgage
$359,200
Outstanding Balance
$265,230
Interest Rate
4.29%
Mortgage Type
New Conventional
Estimated Equity
$570,093
Purchase Details
Closed on
Apr 27, 2012
Sold by
Heritage Wake Forest Inc
Bought by
Mbm Builders Inc
Home Financials for this Owner
Home Financials are based on the most recent Mortgage that was taken out on this home.
Original Mortgage
$340,000
Interest Rate
3.96%
Mortgage Type
Future Advance Clause Open End Mortgage
Purchase Details
Closed on
Jul 30, 2007
Sold by
Shea Homes Llc
Bought by
Heritage Wake Forest Inc
Create a Home Valuation Report for This Property
The Home Valuation Report is an in-depth analysis detailing your home's value as well as a comparison with similar homes in the area
Home Values in the Area
Average Home Value in this Area
Purchase History
| Date | Buyer | Sale Price | Title Company |
|---|---|---|---|
| Christopher Timothy James | $449,000 | None Available | |
| Mbm Builders Inc | $70,000 | None Available | |
| Heritage Wake Forest Inc | $2,880,000 | None Available |
Source: Public Records
Mortgage History
| Date | Status | Borrower | Loan Amount |
|---|---|---|---|
| Open | Christopher Timothy James | $359,200 | |
| Previous Owner | Mbm Builders Inc | $340,000 |
Source: Public Records
Tax History
| Year | Tax Paid | Tax Assessment Tax Assessment Total Assessment is a certain percentage of the fair market value that is determined by local assessors to be the total taxable value of land and additions on the property. | Land | Improvement |
|---|---|---|---|---|
| 2025 | $6,584 | $687,527 | $130,000 | $557,527 |
| 2024 | $6,559 | $687,527 | $130,000 | $557,527 |
Source: Public Records
Map
Nearby Homes
- 404 Vodin St
- 317 Heflin Ct
- 504 Walters Dr
- 308 Stearns Way
- 1013 Heritage Hills Way
- 520 Hallburg Ct
- 401 Hammond Oak Ln
- 1009 Binkley Chapel Ct
- 586 Canvas Dr
- 527 Gateway Townes Blvd
- 598 Canvas Dr
- 978 Gateway Commons Cir
- 249 Artisan Park Dr
- 504 Ledyard Ct
- 1529 Heritage Club Ave
- 740 Rockville Rd
- 1530 Heritage Club Ave
- 216 Artisan Park Dr
- 1237 Remey Ave
- 747 Parkside Townes Ct
- 405 Longmire Point
- 413 Longmire Point
- 401 Longmire Point
- 408 Vodin St
- 1220 Heritage Hills Way
- 408 Longmire Point
- 1216 Heritage Hills Way
- 404 Vodin St
- 1224 Heritage Hills Way
- 501 Pressler Dr
- 501 Pressler St
- 404 Longmire Point
- 400 Vodin St
- 1228 Heritage Hills Way
- 409 Stearns Way
- 505 Pressler St
- 505 Pressler Dr
- 413 Stearns Way
- 1104 Fanning Dr
- 1300 Heritage Hills Way
Your Personal Tour Guide
Ask me questions while you tour the home.