409 Main St Ashfield, MA 01330
Ashfield NeighborhoodEstimated Value: $620,000 - $775,355
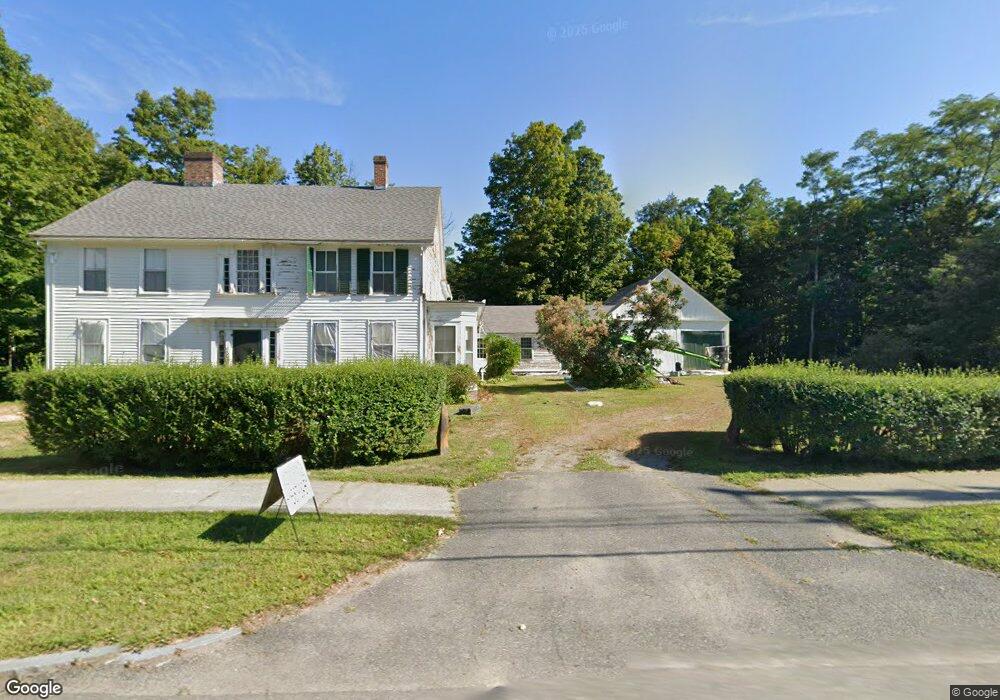
About This Home
This home is located at 409 Main St, Ashfield, MA 01330 and is currently estimated at $685,118, approximately $155 per square foot. 409 Main St is a home located in Franklin County with nearby schools including Mohawk Trail Regional High School.
Ownership History
We collect this data history from publicly available records. To have your information removed, we recommend requesting removal directly through your county’s website.
Purchase Details
Purchase Details
Purchase Details
Home Values in the Area
Average Home Value in this Area
Purchase History
We collect this data history from publicly available records. To have your information removed, we recommend requesting removal directly through your county’s website.
| Date | Buyer | Sale Price | Title Company |
|---|---|---|---|
| -- | None Available | ||
| -- | None Available | ||
| -- | -- | ||
| -- | -- | ||
| -- | -- | ||
| -- | -- | ||
| -- | -- | ||
| -- | -- |
Tax History
We collect this data history from publicly available records. To have your information removed, we recommend requesting removal directly through your county’s website.
| Year | Tax Paid | Tax Assessment Tax Assessment Total Assessment is a certain percentage of the fair market value that is determined by local assessors to be the total taxable value of land and additions on the property. | Land | Improvement |
|---|---|---|---|---|
| 2025 | $9,863 | $732,800 | $97,300 | $635,500 |
| 2024 | $9,979 | $683,000 | $97,300 | $585,700 |
| 2023 | $9,631 | $546,900 | $78,700 | $468,200 |
| 2022 | $9,031 | $519,600 | $75,200 | $444,400 |
| 2021 | $8,338 | $503,800 | $75,200 | $428,600 |
| 2020 | $8,393 | $503,800 | $75,200 | $428,600 |
| 2019 | $7,794 | $454,200 | $71,800 | $382,400 |
| 2018 | $7,678 | $446,900 | $71,800 | $375,100 |
| 2017 | $7,234 | $446,000 | $70,900 | $375,100 |
| 2016 | $6,851 | $416,700 | $70,900 | $345,800 |
| 2015 | $6,655 | $416,700 | $70,900 | $345,800 |
| 2014 | $6,702 | $414,700 | $66,400 | $348,300 |
Map
- 14 South St
- 193 Norton Hill Rd
- 197 Buckland Rd
- 965 Conway Rd
- 0 N Bear River Rd Unit 73485981
- Lot 60 Apple Valley Rd
- 0 Sears Rd Unit 73373850
- 0 Old Stage Rd Unit 73528367
- 1230 Main Poland Rd
- 486 Old Stage Rd
- 55 Orcutt Hill Rd
- 120 Bray Rd
- 200 Lower St
- 15 Orcutt Hill Rd
- 333 Ranney Corner Rd
- 2 Cross St
- 87 Ashfield Rd
- 6 Cross St
- 55 Ashfield Rd
- 311 Cummington Rd
Ask me questions while you tour the home.