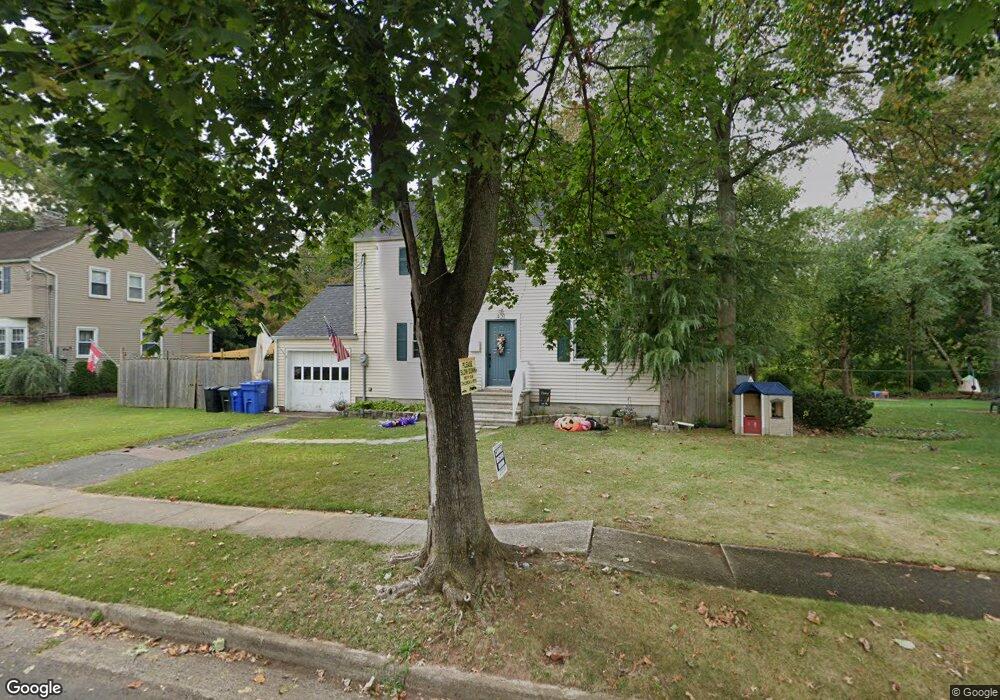
409 Melrose Ave Middlesex, NJ 08846
Estimated Value: $484,000 - $520,000
Studio
--
Bath
1,344
Sq Ft
$373/Sq Ft
Est. Value
About This Home
This home is located at 409 Melrose Ave, Middlesex, NJ 08846 and is currently estimated at $501,431, approximately $373 per square foot. 409 Melrose Ave is a home located in Middlesex County with nearby schools including Middlesex High School and Our Lady of Mount Virgin School.
Ownership History
Date
Name
Owned For
Owner Type
Purchase Details
Closed on
Jul 1, 2019
Sold by
Shinn Bradley D and Shinn Jacqueline M
Bought by
Pang Tyler R and Pang Megan M E
Current Estimated Value
Home Financials for this Owner
Home Financials are based on the most recent Mortgage that was taken out on this home.
Original Mortgage
$241,445
Outstanding Balance
$212,814
Interest Rate
4.12%
Mortgage Type
FHA
Estimated Equity
$288,617
Purchase Details
Closed on
Feb 11, 2011
Sold by
Shinn Bradley P and Shinn Jacqueline M
Bought by
Shinn Bradley D and Shinn Jacqueline M
Purchase Details
Closed on
Dec 26, 2002
Sold by
Monroe Kalian and Monroe Spectrum
Bought by
Dancyger Diana
Create a Home Valuation Report for This Property
The Home Valuation Report is an in-depth analysis detailing your home's value as well as a comparison with similar homes in the area
Home Values in the Area
Average Home Value in this Area
Purchase History
| Date | Buyer | Sale Price | Title Company |
|---|---|---|---|
| Pang Tyler R | $245,900 | Title Masters Llc | |
| Shinn Bradley D | -- | None Available | |
| Dancyger Diana | $291,597 | -- |
Source: Public Records
Mortgage History
| Date | Status | Borrower | Loan Amount |
|---|---|---|---|
| Open | Pang Tyler R | $241,445 |
Source: Public Records
Tax History
| Year | Tax Paid | Tax Assessment Tax Assessment Total Assessment is a certain percentage of the fair market value that is determined by local assessors to be the total taxable value of land and additions on the property. | Land | Improvement |
|---|---|---|---|---|
| 2025 | $9,781 | $504,400 | $135,700 | $368,700 |
| 2024 | $9,312 | $422,700 | $135,700 | $287,000 |
Source: Public Records
Map
Nearby Homes
- 407 Clinton Ave
- 116 Greene Ave
- 531 Chestnut St
- 134 Benart Place
- 303 Ashland Rd
- 311 Chestnut St
- 241 Cook Ave
- 310 Howard Ave
- 101 Lorraine Ave
- 216 Chestnut St
- 212 Vesper Ave
- 151 Beechwood Ave
- 531 Harris Ave
- 238 Luca Dr
- 238 Luca Dr Unit 8
- 533 Edgeworth St
- 129 Forest Dr
- 168 Forest Dr
- 230 Vasser Dr
- 643 Drake Ave
- 405 Melrose Ave
- 413 Melrose Ave
- 414 Melrose Ave
- 418 Melrose Ave
- 410 Melrose Ave
- 401 Melrose Ave
- 417 Melrose Ave
- 406 Melrose Ave
- 422 Melrose Ave
- 402 Melrose Ave
- 0 Melrose Ave Unit 205
- 413 Fairview Ave
- 417 Fairview Ave
- 409 Fairview Ave
- 421 Melrose Ave
- 426 Melrose Ave
- 421 Fairview Ave
- 405 Fairview Ave
- 425 Fairview Ave
- 337 Melrose Ave
Your Personal Tour Guide
Ask me questions while you tour the home.