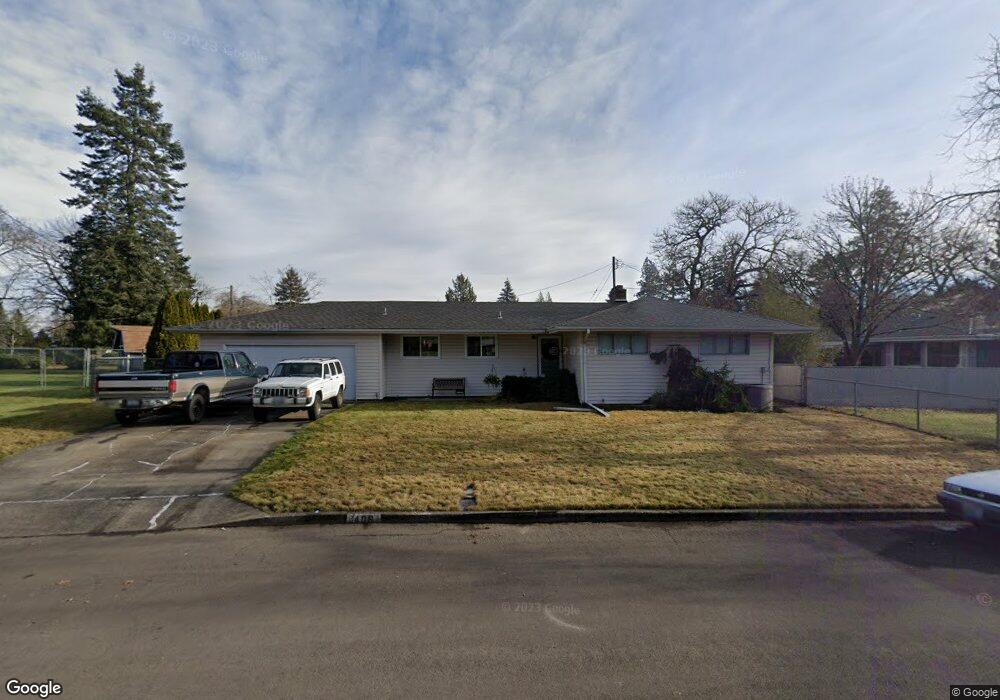
409 Mobile Way Vancouver, WA 98664
Estimated Value: $447,000 - $498,000
3
Beds
2
Baths
1,162
Sq Ft
$403/Sq Ft
Est. Value
About This Home
This home is located at 409 Mobile Way, Vancouver, WA 98664 and is currently estimated at $468,536, approximately $403 per square foot. 409 Mobile Way is a home located in Clark County with nearby schools including George C. Marshall Elementary School, McLoughlin Middle School, and Fort Vancouver High School.
Ownership History
Date
Name
Owned For
Owner Type
Purchase Details
Closed on
Jan 8, 2013
Sold by
Kluthe Roy A and Kluthe Laura
Bought by
Smith Roger and Smith Lisa
Current Estimated Value
Home Financials for this Owner
Home Financials are based on the most recent Mortgage that was taken out on this home.
Original Mortgage
$156,750
Outstanding Balance
$108,478
Interest Rate
3.27%
Mortgage Type
New Conventional
Estimated Equity
$360,058
Purchase Details
Closed on
Mar 2, 2010
Sold by
Kluthe Roy A
Bought by
Kluthe Jenifer D
Purchase Details
Closed on
Jul 14, 1997
Sold by
Johnson Charles R and Johnson Charles R
Bought by
Kluthe Roy A and Kluthe Jenifer D
Home Financials for this Owner
Home Financials are based on the most recent Mortgage that was taken out on this home.
Original Mortgage
$103,900
Interest Rate
7.83%
Create a Home Valuation Report for This Property
The Home Valuation Report is an in-depth analysis detailing your home's value as well as a comparison with similar homes in the area
Home Values in the Area
Average Home Value in this Area
Purchase History
| Date | Buyer | Sale Price | Title Company |
|---|---|---|---|
| Smith Roger | $165,000 | Chicago Title | |
| Kluthe Jenifer D | -- | None Available | |
| Kluthe Roy A | $129,900 | First American Title Ins Co |
Source: Public Records
Mortgage History
| Date | Status | Borrower | Loan Amount |
|---|---|---|---|
| Open | Smith Roger | $156,750 | |
| Previous Owner | Kluthe Roy A | $103,900 |
Source: Public Records
Tax History Compared to Growth
Tax History
| Year | Tax Paid | Tax Assessment Tax Assessment Total Assessment is a certain percentage of the fair market value that is determined by local assessors to be the total taxable value of land and additions on the property. | Land | Improvement |
|---|---|---|---|---|
| 2025 | $4,132 | $442,900 | $187,896 | $255,004 |
| 2024 | $4,032 | $422,994 | $187,896 | $235,098 |
| 2023 | $3,921 | $430,917 | $187,896 | $243,021 |
| 2022 | $3,623 | $420,764 | $187,896 | $232,868 |
| 2021 | $3,527 | $362,137 | $160,600 | $201,537 |
| 2020 | $3,226 | $332,359 | $140,270 | $192,089 |
| 2019 | $2,952 | $314,997 | $129,360 | $185,637 |
| 2018 | $3,102 | $298,518 | $0 | $0 |
| 2017 | $2,746 | $260,483 | $0 | $0 |
| 2016 | $2,488 | $240,559 | $0 | $0 |
| 2015 | $2,458 | $208,332 | $0 | $0 |
| 2014 | -- | $194,598 | $0 | $0 |
| 2013 | -- | $166,659 | $0 | $0 |
Source: Public Records
Map
Nearby Homes
- 7012 Louisiana Dr
- 124 S Fredericksburg Way
- 829 SE Morgan Rd
- 6906 Tennessee Ln
- 7520 SE Middle Way
- 6804 Louisiana Dr
- 6901 SE Middle Way
- 1115 SE Morgan Rd
- 7506 SE Evergreen Hwy
- 8014 SE Middle Way
- 6903 SE Riverside Dr Unit 12
- 300 Baltimore Way
- 1511 SE 75th Ct
- 7010 Ohio Dr
- 8318 SE Middle Way
- 700 Garrison Terrace
- 1323 SE Columbia Crest Ct
- 8607 Mount Thielson Ave
- 8015 SE Evergreen Hwy
- 6019 SE Riverside Dr
- 7304 Alabama Dr
- 7220 Louisiana Dr
- 406 SE Morrison Rd
- 412 S Morrison Rd
- 400 SE Morrison Rd
- 7216 Louisiana Dr
- 7305 Alabama Dr
- 7216 Mississippi Dr
- 7210 Louisiana Dr
- 508 S Morrison Rd
- 509 Mobile Way
- 409 S Morrison Rd
- 7208 Mississippi Dr
- 419 S Morrison Rd
- 7204 Louisiana Dr
- 7202 Mississippi Dr
- 7301 Mississippi Dr
- 7414 Alabama Dr
- 7217 Mississippi Dr