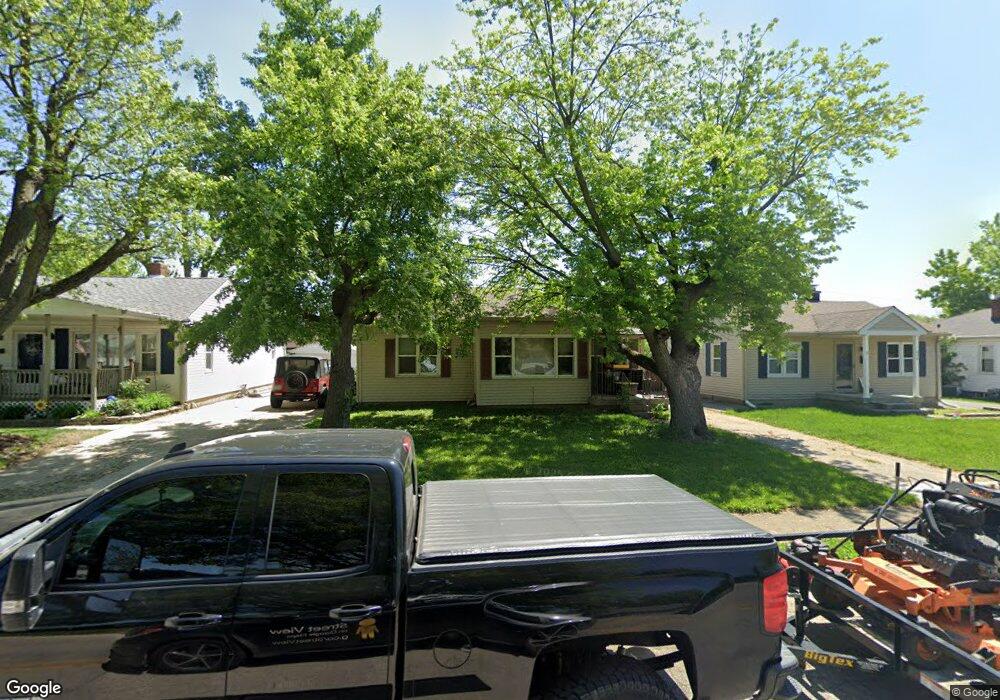
409 N 13th Ave Beech Grove, IN 46107
Estimated Value: $202,000 - $239,000
3
Beds
2
Baths
1,938
Sq Ft
$110/Sq Ft
Est. Value
About This Home
This home is located at 409 N 13th Ave, Beech Grove, IN 46107 and is currently estimated at $214,049, approximately $110 per square foot. 409 N 13th Ave is a home located in Marion County with nearby schools including Hornet Park Elementary School, Central Elementary School, and South Grove Intermediate School.
Ownership History
Date
Name
Owned For
Owner Type
Purchase Details
Closed on
Jul 20, 2022
Sold by
Ann Downer Betty
Bought by
Parker Paul A
Current Estimated Value
Purchase Details
Closed on
Jul 30, 2008
Sold by
Mcvey Lawrence and Mcvey Stephanie
Bought by
Downer John D and Downer Betty Ann
Home Financials for this Owner
Home Financials are based on the most recent Mortgage that was taken out on this home.
Original Mortgage
$84,800
Interest Rate
6.39%
Mortgage Type
Purchase Money Mortgage
Purchase Details
Closed on
Feb 29, 2008
Sold by
Secretary Of Housing & Urban Development
Bought by
Mcvey Lawrence and Mcvey Stephanie
Purchase Details
Closed on
Sep 11, 2007
Sold by
Coutrywide Home Loans Inc
Bought by
Secretary Of Hud
Purchase Details
Closed on
Jul 31, 2007
Sold by
Ludlow Andrew R and Greater Indianapolis Firefight
Bought by
Countrywide Home Loans Inc
Create a Home Valuation Report for This Property
The Home Valuation Report is an in-depth analysis detailing your home's value as well as a comparison with similar homes in the area
Home Values in the Area
Average Home Value in this Area
Purchase History
| Date | Buyer | Sale Price | Title Company |
|---|---|---|---|
| Parker Paul A | -- | None Listed On Document | |
| Downer John D | -- | Fat | |
| Mcvey Lawrence | -- | Village Title Inc | |
| Secretary Of Hud | -- | None Available | |
| Countrywide Home Loans Inc | $97,663 | None Available |
Source: Public Records
Mortgage History
| Date | Status | Borrower | Loan Amount |
|---|---|---|---|
| Previous Owner | Downer John D | $84,800 |
Source: Public Records
Tax History Compared to Growth
Tax History
| Year | Tax Paid | Tax Assessment Tax Assessment Total Assessment is a certain percentage of the fair market value that is determined by local assessors to be the total taxable value of land and additions on the property. | Land | Improvement |
|---|---|---|---|---|
| 2024 | $4,261 | $144,800 | $17,900 | $126,900 |
| 2023 | $4,261 | $152,800 | $17,900 | $134,900 |
| 2022 | $3,922 | $137,100 | $17,900 | $119,200 |
| 2021 | $3,204 | $115,700 | $17,900 | $97,800 |
| 2020 | $2,744 | $105,400 | $17,900 | $87,500 |
| 2019 | $2,460 | $98,000 | $13,300 | $84,700 |
| 2018 | $2,336 | $96,400 | $13,300 | $83,100 |
| 2017 | $2,234 | $89,200 | $13,300 | $75,900 |
| 2016 | $2,135 | $86,100 | $13,300 | $72,800 |
| 2014 | $1,972 | $83,800 | $13,300 | $70,500 |
| 2013 | $1,972 | $83,800 | $13,300 | $70,500 |
Source: Public Records
Map
Nearby Homes