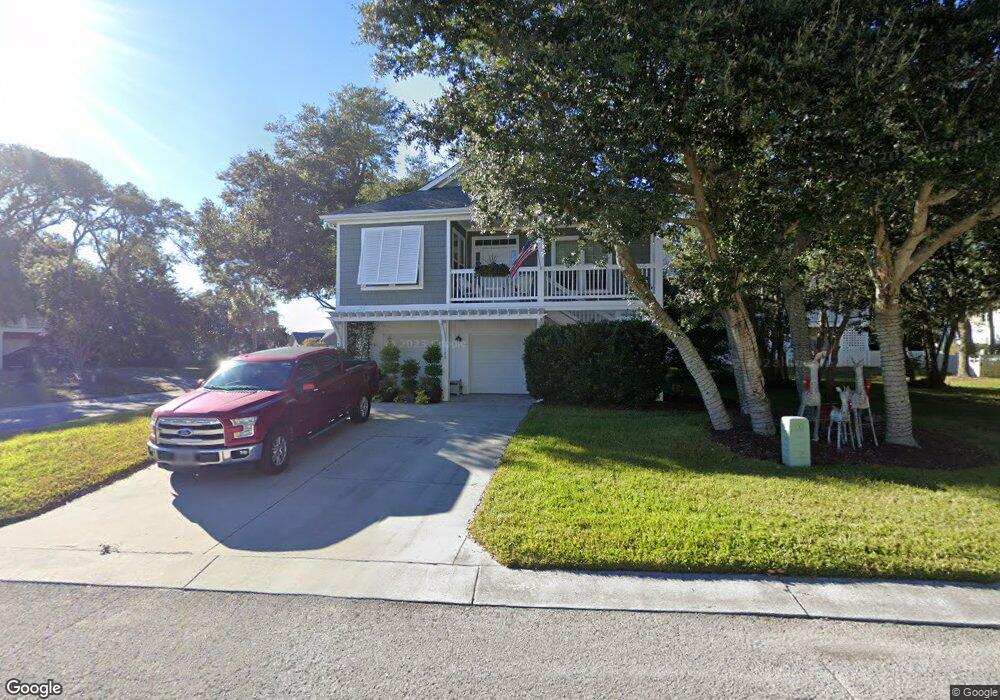
409 N 4th Ave Kure Beach, NC 28449
Estimated Value: $699,000 - $1,006,000
3
Beds
3
Baths
2,604
Sq Ft
$343/Sq Ft
Est. Value
About This Home
This home is located at 409 N 4th Ave, Kure Beach, NC 28449 and is currently estimated at $893,345, approximately $343 per square foot. 409 N 4th Ave is a home located in New Hanover County with nearby schools including Carolina Beach Elementary School, Charles P. Murray Middle School, and Eugene Ashley High School.
Ownership History
Date
Name
Owned For
Owner Type
Purchase Details
Closed on
Dec 31, 2019
Sold by
Smith Britt Marie
Bought by
Smith Britt Marie and Blackburn Roland Charles
Current Estimated Value
Purchase Details
Closed on
Feb 9, 2009
Sold by
Smith Charles R
Bought by
Smith Britt Marie
Purchase Details
Closed on
Feb 27, 2007
Sold by
Hearne Joseph C and Hearne Nancy K
Bought by
Smith Britt M
Purchase Details
Closed on
Apr 23, 1998
Sold by
Kure Beach Associates
Bought by
Hearne Joseph C Nancy K
Purchase Details
Closed on
Jan 1, 1986
Sold by
Kure Beach Associates
Bought by
Kure Beach Associates
Purchase Details
Closed on
Oct 1, 1985
Sold by
L & H Investments
Bought by
Kure Beach Associates
Create a Home Valuation Report for This Property
The Home Valuation Report is an in-depth analysis detailing your home's value as well as a comparison with similar homes in the area
Home Values in the Area
Average Home Value in this Area
Purchase History
| Date | Buyer | Sale Price | Title Company |
|---|---|---|---|
| Smith Britt Marie | -- | None Available | |
| Smith Britt Marie | -- | None Available | |
| Smith Britt M | $50,000 | None Available | |
| Hearne Joseph C Nancy K | $50,000 | -- | |
| Kure Beach Associates | -- | -- | |
| Kure Beach Associates | $1,750,000 | -- |
Source: Public Records
Tax History Compared to Growth
Tax History
| Year | Tax Paid | Tax Assessment Tax Assessment Total Assessment is a certain percentage of the fair market value that is determined by local assessors to be the total taxable value of land and additions on the property. | Land | Improvement |
|---|---|---|---|---|
| 2025 | $3,744 | $805,700 | $451,500 | $354,200 |
| 2023 | $3,744 | $505,900 | $177,100 | $328,800 |
| 2022 | $3,647 | $505,900 | $177,100 | $328,800 |
| 2021 | $3,748 | $505,900 | $177,100 | $328,800 |
| 2020 | $3,518 | $393,100 | $192,300 | $200,800 |
| 2019 | $3,518 | $393,100 | $192,300 | $200,800 |
| 2018 | $3,479 | $393,100 | $192,300 | $200,800 |
| 2017 | $3,361 | $393,100 | $192,300 | $200,800 |
| 2016 | $3,806 | $419,200 | $155,800 | $263,400 |
| 2015 | $3,502 | $419,200 | $155,800 | $263,400 |
| 2014 | $3,419 | $419,200 | $155,800 | $263,400 |
Source: Public Records
Map
Nearby Homes
- 337 N Fort Fisher Blvd
- 438 Sandman Dr
- 317 N Fort Fisher Blvd
- 310 N 4th Ave
- 313 N Fort Fisher Blvd Unit A
- 509 Shell Dr Unit A
- 301 N Fort Fisher Blvd Unit B
- 310 Fort Fisher Blvd N
- 410 N Fort Fisher Blvd
- 221 Seawatch Way Unit LT5050
- 230 Third Ave N Unit A
- 601 Sloop Pointe Ln
- 218 N 3rd Ave
- 209 N Ave
- 202 N Fort Fisher Blvd Unit A3
- 121 N 4th Ave Unit A
- 805 Kure Village Way
- 605 Fort Fisher Blvd N Unit A
- 305 Kure Village Way
- 613 K Ave
- 608 Sandman Dr
- 417 N 4th Ave
- 601 Sandman Dr
- 612 Sandman Dr Unit LT83
- 516 Sandman Dr
- 421 N 4th Ave
- 517 Sandman Dr
- 410 Anchor Way
- 616 Sandman Dr
- 416 N 4th Ave
- 414 Anchor Way
- 425 N 4th Ave
- 313 Sandman Dr
- 420 N 4th Ave
- 436 N Fourth Ave
- 508 Sandman Dr
- 418 Anchor Way
- 429 N 4th Ave
- 509 Sandman Dr
- 424 N 4th Ave