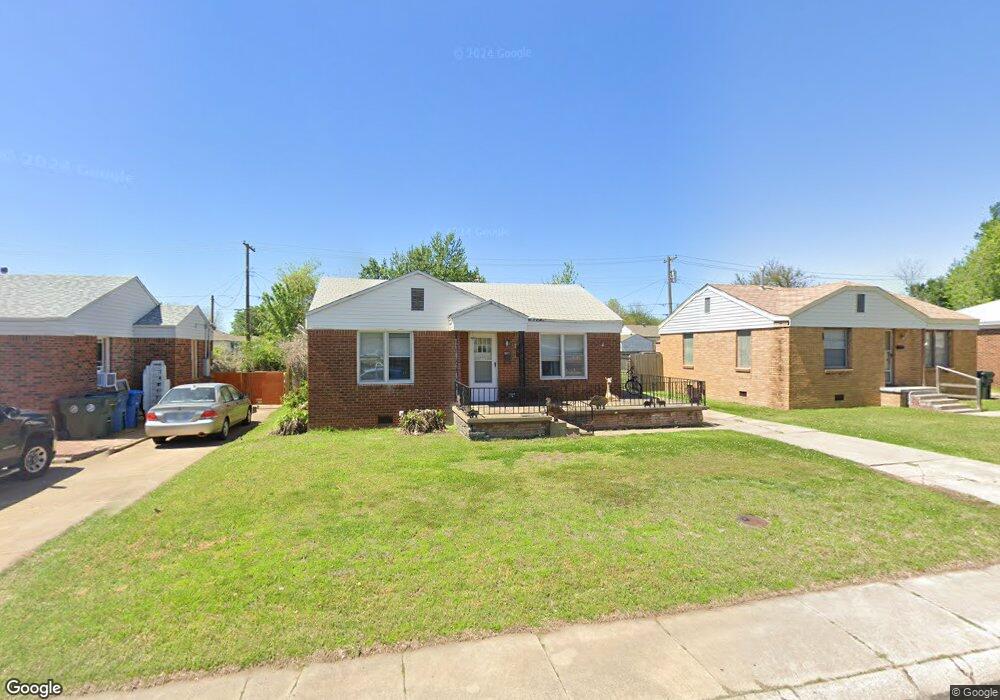
409 N Key Blvd Oklahoma City, OK 73110
Estimated Value: $84,991 - $116,000
2
Beds
1
Bath
794
Sq Ft
$122/Sq Ft
Est. Value
About This Home
This home is located at 409 N Key Blvd, Oklahoma City, OK 73110 and is currently estimated at $97,248, approximately $122 per square foot. 409 N Key Blvd is a home located in Oklahoma County with nearby schools including Midwest City Elementary School, Midwest City Middle School, and Midwest City High School.
Ownership History
Date
Name
Owned For
Owner Type
Purchase Details
Closed on
Jul 25, 2018
Sold by
Itron Investments Llc
Bought by
Casa Rentals Llc
Current Estimated Value
Home Financials for this Owner
Home Financials are based on the most recent Mortgage that was taken out on this home.
Original Mortgage
$50,000
Outstanding Balance
$43,428
Interest Rate
4.6%
Mortgage Type
Commercial
Estimated Equity
$53,820
Purchase Details
Closed on
Jun 29, 2018
Sold by
Tarlton Paul S and The Helen Tarlton Living Trust
Bought by
Itron Investments Llc
Home Financials for this Owner
Home Financials are based on the most recent Mortgage that was taken out on this home.
Original Mortgage
$50,000
Outstanding Balance
$43,428
Interest Rate
4.6%
Mortgage Type
Commercial
Estimated Equity
$53,820
Purchase Details
Closed on
May 3, 2011
Sold by
Tarleton Helen M
Bought by
Tarleton Helen M and Helen M Tarleton Living Trust
Create a Home Valuation Report for This Property
The Home Valuation Report is an in-depth analysis detailing your home's value as well as a comparison with similar homes in the area
Home Values in the Area
Average Home Value in this Area
Purchase History
| Date | Buyer | Sale Price | Title Company |
|---|---|---|---|
| Casa Rentals Llc | $66,000 | Trustmark Title | |
| Itron Investments Llc | $25,000 | Trustmark Title | |
| Tarleton Helen M | -- | None Available |
Source: Public Records
Mortgage History
| Date | Status | Borrower | Loan Amount |
|---|---|---|---|
| Open | Casa Rentals Llc | $50,000 |
Source: Public Records
Tax History Compared to Growth
Tax History
| Year | Tax Paid | Tax Assessment Tax Assessment Total Assessment is a certain percentage of the fair market value that is determined by local assessors to be the total taxable value of land and additions on the property. | Land | Improvement |
|---|---|---|---|---|
| 2024 | $742 | $6,618 | $1,330 | $5,288 |
| 2023 | $742 | $6,303 | $1,064 | $5,239 |
| 2022 | $700 | $6,002 | $1,107 | $4,895 |
| 2021 | $683 | $5,717 | $1,233 | $4,484 |
| 2020 | $668 | $5,445 | $1,328 | $4,117 |
| 2019 | $659 | $5,610 | $1,037 | $4,573 |
| 2018 | $377 | $3,419 | $0 | $0 |
| 2017 | $141 | $3,255 | $639 | $2,616 |
| 2016 | $144 | $3,255 | $667 | $2,588 |
| 2015 | $150 | $3,255 | $817 | $2,438 |
| 2014 | $150 | $3,255 | $820 | $2,435 |
Source: Public Records
Map
Nearby Homes
- 507 E Curtis Dr
- 314 E Ercoupe Dr
- 521 E Douglas Dr
- 528 E Grumman Dr
- 511 N Key Blvd
- 517 E Boeing Dr
- 217 E Douglas Dr
- 503 E Indian Dr
- 516 Monroney Dr
- 516 E Rickenbacker Dr
- 518 E Lockheed Dr
- 556 Babb Dr
- 536 E Atkinson Dr
- 204 W Ercoupe Dr
- 202 E Northrup Dr
- 608 W Rickenbacker Dr
- 501 E Showalter Dr
- 109 E Northrup Dr
- 210 E Myrtle Dr
- 221 E Myrtle Dr
- 407 N Key Blvd
- 411 N Key Blvd
- 405 N Key Blvd
- 413 N Key Blvd
- 406 N Marshall Dr
- 408 N Marshall Dr
- 404 N Marshall Dr
- 501 E Ercoupe Dr
- 403 N Key Blvd
- 415 N Key Blvd
- 410 N Marshall Dr
- 402 N Marshall Dr
- 503 E Ercoupe Dr
- 500 E Fairchild Dr
- 412 N Marshall Dr
- 401 N Key Blvd
- 417 N Key Blvd
- 502 E Fairchild Dr
- 505 E Ercoupe Dr
- 419 N Key Blvd