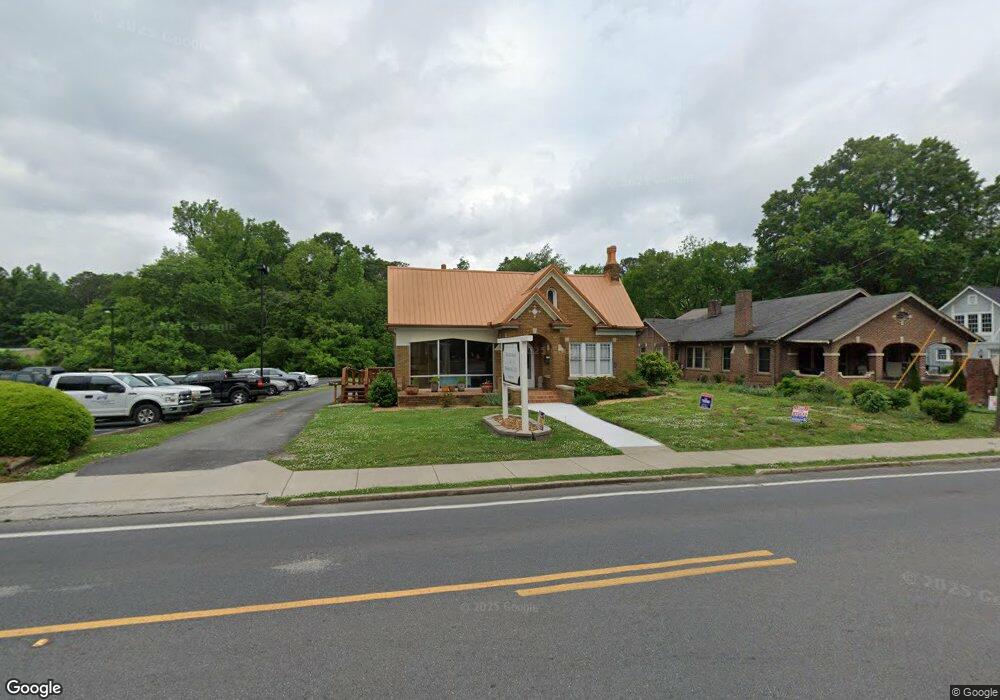
409 N Main St La Fayette, GA 30728
Estimated Value: $245,000 - $275,000
3
Beds
3
Baths
1,862
Sq Ft
$141/Sq Ft
Est. Value
About This Home
This home is located at 409 N Main St, La Fayette, GA 30728 and is currently estimated at $263,101, approximately $141 per square foot. 409 N Main St is a home located in Walker County with nearby schools including North Lafayette Elementary School, Lafayette Middle School, and Lafayette High School.
Ownership History
Date
Name
Owned For
Owner Type
Purchase Details
Closed on
Sep 28, 2024
Sold by
Barclay Jennifer
Bought by
Hall Julie Dale
Current Estimated Value
Purchase Details
Closed on
Mar 26, 2021
Sold by
Caheely Cynthia D
Bought by
Hall Julie Dale and Barclay Jennifer
Home Financials for this Owner
Home Financials are based on the most recent Mortgage that was taken out on this home.
Original Mortgage
$147,828
Interest Rate
2.9%
Mortgage Type
New Conventional
Purchase Details
Closed on
Sep 8, 1989
Sold by
Hammond Miriam L
Bought by
Caheely Cynthia D Dorothy F
Purchase Details
Closed on
Aug 11, 1980
Sold by
Hammond Mrs D W
Bought by
Hammond Miriam L
Purchase Details
Closed on
Jan 1, 1972
Bought by
Hammond Mrs D W
Create a Home Valuation Report for This Property
The Home Valuation Report is an in-depth analysis detailing your home's value as well as a comparison with similar homes in the area
Home Values in the Area
Average Home Value in this Area
Purchase History
| Date | Buyer | Sale Price | Title Company |
|---|---|---|---|
| Hall Julie Dale | -- | -- | |
| Hall Julie Dale | $179,900 | -- | |
| Caheely Cynthia D Dorothy F | $66,500 | -- | |
| Hammond Miriam L | -- | -- | |
| Hammond Mrs D W | -- | -- |
Source: Public Records
Mortgage History
| Date | Status | Borrower | Loan Amount |
|---|---|---|---|
| Previous Owner | Hall Julie Dale | $147,828 |
Source: Public Records
Tax History Compared to Growth
Tax History
| Year | Tax Paid | Tax Assessment Tax Assessment Total Assessment is a certain percentage of the fair market value that is determined by local assessors to be the total taxable value of land and additions on the property. | Land | Improvement |
|---|---|---|---|---|
| 2024 | $2,343 | $98,377 | $14,611 | $83,766 |
| 2023 | $2,223 | $90,575 | $11,239 | $79,336 |
| 2022 | $1,894 | $80,903 | $11,239 | $69,664 |
| 2021 | $1,517 | $51,671 | $12,931 | $38,740 |
| 2020 | $1,401 | $45,657 | $12,931 | $32,726 |
| 2019 | $1,402 | $45,657 | $12,931 | $32,726 |
| 2018 | $1,358 | $45,657 | $12,931 | $32,726 |
| 2017 | $1,518 | $45,657 | $12,931 | $32,726 |
| 2016 | $1,259 | $45,657 | $12,931 | $32,726 |
| 2015 | $1,025 | $35,433 | $13,248 | $22,185 |
| 2014 | $987 | $35,433 | $13,248 | $22,185 |
| 2013 | -- | $35,432 | $13,248 | $22,184 |
Source: Public Records
Map
Nearby Homes
- 0 Center St Unit 1517720
- 307 Park St
- 207 Culberson Ave
- 7552 Us Highway 27
- 21058 Georgia 193
- 13 Steele St N
- 214 East Ave
- 3 Fortune St
- 0 Farris St Unit 1512317
- 0 Farris St
- 0 Fortune St Unit 1520483
- 1001 N Main St
- 304 S Cherokee St
- 1 & 3 N High St
- 212 S High St
- 204 S High St
- 307 S Duke St
- 702.5 Henderson St
- 114 Mallard Ln
- 111 Dove Dr
- 503 N Main St
- 502 N Main St
- 408 N Main St
- 406 N Main St
- 504 N Main St
- 504 N Main St
- 501 N Main St
- 102 Warthen St
- 404 N Main St
- 104 Warthen St
- 0 Duvall Ln Unit 20127979
- 0 Duvall Ln Unit 1374943
- 0 Duvall Ln Unit 1269868
- 0 Duvall Ln Unit 1046349
- 0 Duvall Ln Unit 1168455
- 0 Duvall Ln Unit 1070899
- 0 Duvall Ln Unit 1352211
- 0 Duvall Ln Unit 20029043
- 0 Duvall Ln Unit 3122773
- 0 Duvall Ln Unit 8341152