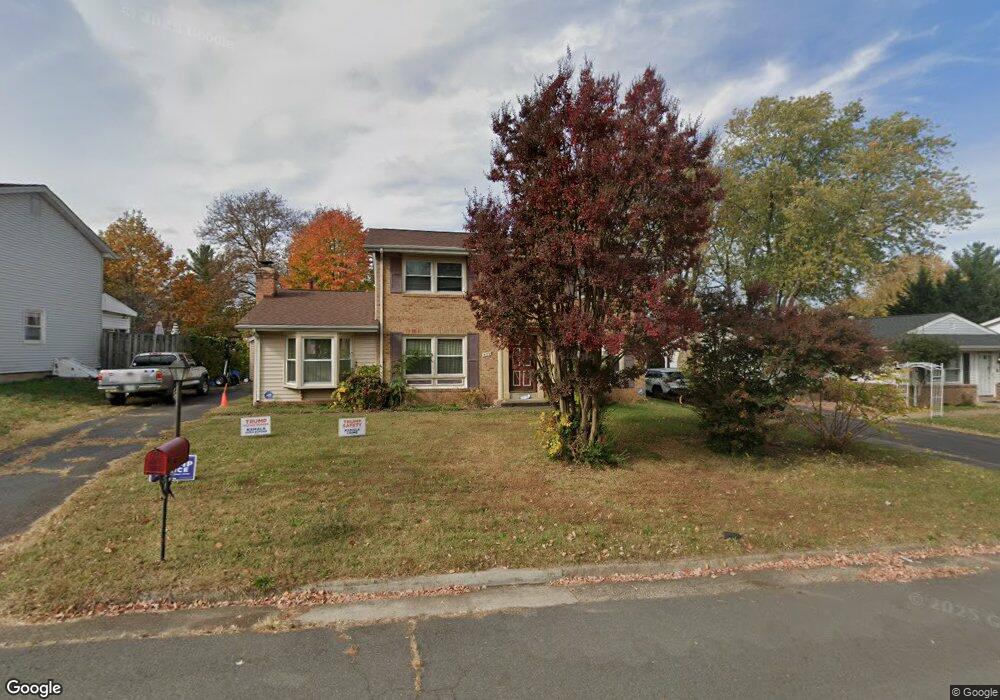
409 N Sterling Blvd Sterling, VA 20164
Estimated Value: $644,129 - $712,000
4
Beds
3
Baths
2,128
Sq Ft
$315/Sq Ft
Est. Value
About This Home
This home is located at 409 N Sterling Blvd, Sterling, VA 20164 and is currently estimated at $670,282, approximately $314 per square foot. 409 N Sterling Blvd is a home located in Loudoun County with nearby schools including Sterling Elementary School, Sterling Middle School, and Park View High School.
Ownership History
Date
Name
Owned For
Owner Type
Purchase Details
Closed on
Jul 9, 2009
Sold by
Thu and Doan Thi Doan
Bought by
Chatterjie Alok
Current Estimated Value
Home Financials for this Owner
Home Financials are based on the most recent Mortgage that was taken out on this home.
Original Mortgage
$268,000
Outstanding Balance
$171,505
Interest Rate
4.93%
Mortgage Type
New Conventional
Estimated Equity
$498,777
Purchase Details
Closed on
May 22, 2008
Sold by
Bank Of New York
Bought by
Doan Thu Trang Thi
Home Financials for this Owner
Home Financials are based on the most recent Mortgage that was taken out on this home.
Original Mortgage
$24,000
Interest Rate
6.07%
Mortgage Type
New Conventional
Purchase Details
Closed on
Oct 17, 2006
Sold by
Phou Chanthearit Mak
Bought by
Mian Faisal
Home Financials for this Owner
Home Financials are based on the most recent Mortgage that was taken out on this home.
Original Mortgage
$452,800
Interest Rate
6.49%
Mortgage Type
New Conventional
Purchase Details
Closed on
Apr 9, 1997
Sold by
Huot + Huon K
Bought by
Phou Vathana and Phou Chanthearit M
Home Financials for this Owner
Home Financials are based on the most recent Mortgage that was taken out on this home.
Original Mortgage
$115,000
Interest Rate
7.55%
Mortgage Type
New Conventional
Create a Home Valuation Report for This Property
The Home Valuation Report is an in-depth analysis detailing your home's value as well as a comparison with similar homes in the area
Home Values in the Area
Average Home Value in this Area
Purchase History
| Date | Buyer | Sale Price | Title Company |
|---|---|---|---|
| Chatterjie Alok | $335,000 | -- | |
| Doan Thu Trang Thi | $300,000 | -- | |
| Mian Faisal | $566,000 | -- | |
| Phou Vathana | -- | Island Title Corp |
Source: Public Records
Mortgage History
| Date | Status | Borrower | Loan Amount |
|---|---|---|---|
| Open | Chatterjie Alok | $268,000 | |
| Previous Owner | Doan Thu Trang Thi | $24,000 | |
| Previous Owner | Mian Faisal | $452,800 | |
| Previous Owner | Phou Vathana | $115,000 |
Source: Public Records
Tax History Compared to Growth
Tax History
| Year | Tax Paid | Tax Assessment Tax Assessment Total Assessment is a certain percentage of the fair market value that is determined by local assessors to be the total taxable value of land and additions on the property. | Land | Improvement |
|---|---|---|---|---|
| 2025 | $4,931 | $612,590 | $233,200 | $379,390 |
| 2024 | $4,795 | $554,310 | $208,200 | $346,110 |
| 2023 | $4,833 | $552,370 | $208,200 | $344,170 |
| 2022 | $4,447 | $499,670 | $188,200 | $311,470 |
| 2021 | $4,354 | $444,320 | $178,200 | $266,120 |
| 2020 | $4,328 | $418,210 | $153,200 | $265,010 |
| 2019 | $4,221 | $403,890 | $153,200 | $250,690 |
| 2018 | $4,054 | $373,600 | $138,200 | $235,400 |
| 2017 | $4,071 | $361,900 | $138,200 | $223,700 |
| 2016 | $4,123 | $360,070 | $0 | $0 |
| 2015 | $3,728 | $208,770 | $0 | $208,770 |
| 2014 | $3,832 | $212,060 | $0 | $212,060 |
Source: Public Records
Map
Nearby Homes
- 409 N Argonne Ave
- 301 N Alder Ave
- 224 W Beech Rd
- 208 Keyes Ct
- 316 Hanford Ct
- 108 N Alder Ave
- 221 N Emory Dr Unit 4
- 113 N College Dr Unit 175
- 1300 E Beech Rd
- 113 N Harrison Rd
- 724 N Amelia St
- 104 N Garfield Rd
- 102 N Garfield Rd
- 346 Lancaster Square
- 1307 E Holly Ave
- 203 N Lincoln Ave
- 202 N Fir Ct
- 1314 E Holly Ave
- 203 N Fir Ct
- 814 N Croydon St
- 411 N Sterling Blvd
- 407 N Sterling Blvd
- 406 N Alder Ave
- 404 N Alder Ave
- 501 N Sterling Blvd
- 405 N Sterling Blvd
- 410 N Alder Ave
- 402 N Alder Ave
- 412 N Alder Ave
- 403 N Sterling Blvd
- 400 N Alder Ave
- 500 N Alder Ave
- 505 N Sterling Blvd
- 401 N Sterling Blvd
- 306 N Alder Ave
- 405 N Alder Ave
- 403 N Alder Ave
- 502 N Alder Ave
- 401 N Alder Ave
- 500 N York Rd