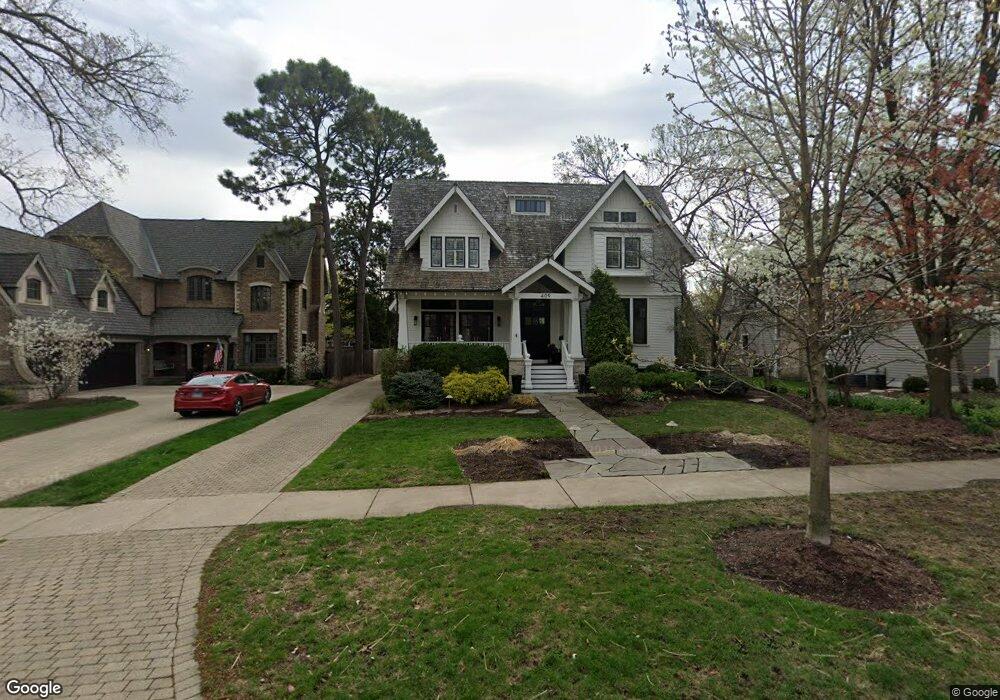
409 N Vine St Hinsdale, IL 60521
North Hinsdale NeighborhoodEstimated Value: $1,676,000 - $2,062,000
--
Bed
1
Bath
3,970
Sq Ft
$487/Sq Ft
Est. Value
About This Home
This home is located at 409 N Vine St, Hinsdale, IL 60521 and is currently estimated at $1,932,844, approximately $486 per square foot. 409 N Vine St is a home located in DuPage County with nearby schools including Monroe Elementary School, Clarendon Hills Middle School, and Hinsdale Central High School.
Ownership History
Date
Name
Owned For
Owner Type
Purchase Details
Closed on
Feb 19, 2018
Sold by
Owens Brian and Owens Amy
Bought by
Owens Michael Brian and Owens Amy Suzanne
Current Estimated Value
Purchase Details
Closed on
Sep 15, 2001
Sold by
Smith Jared R W and Smith Deborah P
Bought by
Owens Brian and Owens Amy
Home Financials for this Owner
Home Financials are based on the most recent Mortgage that was taken out on this home.
Original Mortgage
$460,000
Outstanding Balance
$172,964
Interest Rate
6.5%
Estimated Equity
$1,759,880
Create a Home Valuation Report for This Property
The Home Valuation Report is an in-depth analysis detailing your home's value as well as a comparison with similar homes in the area
Home Values in the Area
Average Home Value in this Area
Purchase History
| Date | Buyer | Sale Price | Title Company |
|---|---|---|---|
| Owens Michael Brian | -- | None Available | |
| Owens Brian | $575,000 | -- |
Source: Public Records
Mortgage History
| Date | Status | Borrower | Loan Amount |
|---|---|---|---|
| Open | Owens Brian | $460,000 |
Source: Public Records
Tax History Compared to Growth
Tax History
| Year | Tax Paid | Tax Assessment Tax Assessment Total Assessment is a certain percentage of the fair market value that is determined by local assessors to be the total taxable value of land and additions on the property. | Land | Improvement |
|---|---|---|---|---|
| 2024 | $29,353 | $574,217 | $110,782 | $463,435 |
| 2023 | $27,921 | $527,870 | $101,840 | $426,030 |
| 2022 | $27,753 | $535,340 | $103,270 | $432,070 |
| 2021 | $26,744 | $529,260 | $102,100 | $427,160 |
| 2020 | $26,140 | $518,780 | $100,080 | $418,700 |
| 2019 | $26,162 | $497,780 | $96,030 | $401,750 |
| 2018 | $25,528 | $503,420 | $95,540 | $407,880 |
| 2017 | $24,608 | $484,430 | $91,940 | $392,490 |
| 2016 | $24,143 | $462,330 | $87,750 | $374,580 |
| 2015 | $24,045 | $434,970 | $82,560 | $352,410 |
| 2014 | $22,746 | $397,530 | $80,270 | $317,260 |
| 2013 | $21,978 | $395,670 | $79,890 | $315,780 |
Source: Public Records
Map
Nearby Homes
- 210 W Hickory St
- 123 N Vine St
- 118 N Grant St
- 539 Kensington Ct
- 527 Kensington Ct
- 216 Bonnie Brae Rd
- 117 N Monroe St
- 415 N Adams St
- 531 N York Rd
- 28 S Clay St
- 14 S Thurlow St
- 401 Birchwood Rd
- 125 S Madison St
- 401 Glendale Ave
- 317 E Walnut St
- 21 S Bruner St
- 11S110 LOT Madison St
- 6 S Elm St
- 719 N Elm St
- 246 N Jackson Rd