Estimated Value: $608,717
Studio
--
Bath
9,340
Sq Ft
$65/Sq Ft
Est. Value
About This Home
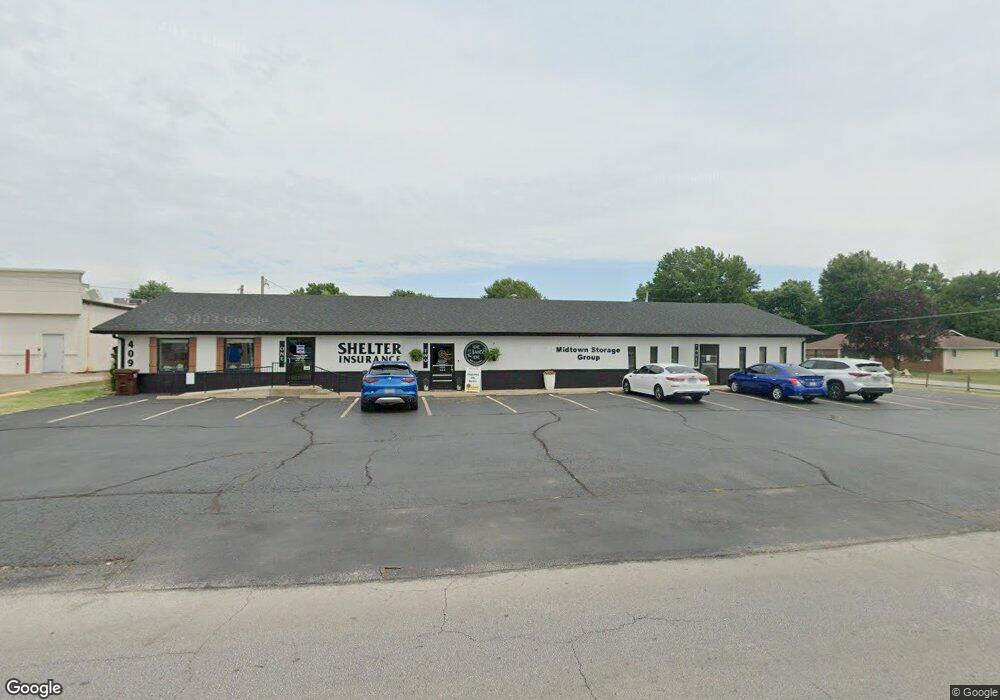
This home is located at 409 Northview Rd, Nixa, MO 65714 and is currently priced at $608,717, approximately $65 per square foot. 409 Northview Rd is a home located in Christian County with nearby schools including Summit Intermediate School, High Pointe Elementary School, and Nixa Junior High School.
Ownership History
Date
Name
Owned For
Owner Type
Purchase Details
Closed on
Apr 15, 2016
Sold by
Estes Capital & Investment Llc
Bought by
Rmp Investments Llc
Current Estimated Value
Purchase Details
Closed on
Oct 23, 2015
Sold by
Dancing Bear Llc
Bought by
Estes Capital & Investment Llc
Home Financials for this Owner
Home Financials are based on the most recent Mortgage that was taken out on this home.
Original Mortgage
$293,250
Interest Rate
3.9%
Mortgage Type
Future Advance Clause Open End Mortgage
Purchase Details
Closed on
Aug 5, 2005
Sold by
Pfankuch Bob and Pfankuch Beverly
Bought by
Dancing Bear Llc
Home Financials for this Owner
Home Financials are based on the most recent Mortgage that was taken out on this home.
Original Mortgage
$315,000
Interest Rate
7%
Mortgage Type
Purchase Money Mortgage
Create a Home Valuation Report for This Property
The Home Valuation Report is an in-depth analysis detailing your home's value as well as a comparison with similar homes in the area
Home Values in the Area
Average Home Value in this Area
Purchase History
| Date | Buyer | Sale Price | Title Company |
|---|---|---|---|
| Rmp Investments Llc | -- | Ozark Abstract & Title | |
| Estes Capital & Investment Llc | -- | Hogan Land Title Company | |
| Dancing Bear Llc | -- | None Available |
Source: Public Records
Mortgage History
| Date | Status | Borrower | Loan Amount |
|---|---|---|---|
| Previous Owner | Estes Capital & Investment Llc | $293,250 | |
| Previous Owner | Dancing Bear Llc | $315,000 |
Source: Public Records
Tax History
| Year | Tax Paid | Tax Assessment Tax Assessment Total Assessment is a certain percentage of the fair market value that is determined by local assessors to be the total taxable value of land and additions on the property. | Land | Improvement |
|---|---|---|---|---|
| 2025 | $6,328 | $109,340 | -- | -- |
| 2024 | $6,328 | $96,290 | -- | -- |
| 2023 | $6,328 | $96,290 | $0 | $0 |
| 2022 | $5,561 | $84,510 | $0 | $0 |
| 2021 | $5,564 | $84,510 | $0 | $0 |
| 2020 | $5,245 | $76,220 | $0 | $0 |
| 2019 | $5,245 | $76,220 | $0 | $0 |
| 2018 | $4,906 | $76,260 | $0 | $0 |
| 2017 | $4,906 | $76,260 | $0 | $0 |
| 2016 | $4,835 | $76,260 | $0 | $0 |
| 2015 | $4,841 | $76,260 | $76,260 | $0 |
| 2014 | $5,233 | $84,380 | $0 | $0 |
| 2013 | $48 | $84,380 | $0 | $0 |
| 2011 | $48 | $155,580 | $0 | $0 |
Source: Public Records
Map
Nearby Homes
- 907 Northview Dr
- 902 Foxwood Dr
- 911 Brooke Ct
- 107 Northview Rd
- 207 W Park St
- 102 W Bennett St
- 609 N Elderberry Ln
- 000 (Tbd) Highway 160 (14 8 Acres) St
- 410 N Prospect St
- 405 N Missouri Ave
- 805 W Briarwood Ln
- 407 Slim Wilson Blvd
- 711 Robinwood Ln
- 108 W Walnut St
- 307 N Prospect St
- 308 N Prospect St
- 0 Missouri -- Unit 643 6915104
- 1281 N Maxine Ave
- 1343 N Maxine Ave
- Lot 24 the Village of Cloverhill
- 411 Northview Rd Unit G
- 411 Northview Rd Unit E
- 411 Northview Rd Unit E & G
- 411 Northview Rd
- 804 Northview Dr
- 805 Northview Dr
- 806 Northview Dr
- 806 Westview Dr
- 806 Westview Dr
- 808 Northview Dr
- 807 Northview Dr
- 805 N Dabney Ave
- 807 N Dabney Ave
- 808 Westview Dr
- 811 N Dabney Ave
- 809 Northview Dr
- 810 Northview Dr
- 810 Westview Dr
- 813 N Dabney Ave
- 400 Northview Rd
Your Personal Tour Guide
Ask me questions while you tour the home.