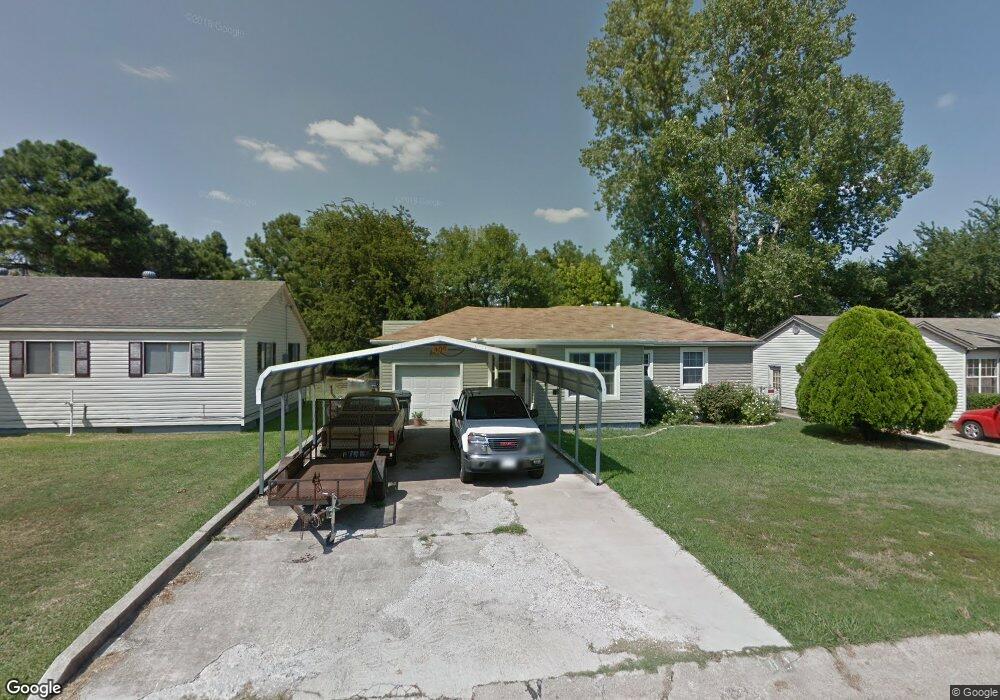
409 Oak St Ardmore, OK 73401
Estimated Value: $120,000 - $154,000
3
Beds
1
Bath
1,412
Sq Ft
$100/Sq Ft
Est. Value
About This Home
This home is located at 409 Oak St, Ardmore, OK 73401 and is currently estimated at $140,568, approximately $99 per square foot. 409 Oak St is a home located in Carter County with nearby schools including Charles Evans Elementary School, Ardmore Middle School, and Ardmore High School.
Ownership History
Date
Name
Owned For
Owner Type
Purchase Details
Closed on
Aug 24, 2009
Sold by
Sanchez Joel and Sanchez Karla
Bought by
Jeter Darrell K
Current Estimated Value
Home Financials for this Owner
Home Financials are based on the most recent Mortgage that was taken out on this home.
Original Mortgage
$65,550
Outstanding Balance
$42,279
Interest Rate
5.16%
Mortgage Type
New Conventional
Estimated Equity
$98,289
Purchase Details
Closed on
Sep 21, 2005
Sold by
Manning David S and Manning Kerri
Bought by
Sanchez Joel and Sanchez Karla
Home Financials for this Owner
Home Financials are based on the most recent Mortgage that was taken out on this home.
Original Mortgage
$39,900
Interest Rate
5.73%
Mortgage Type
New Conventional
Purchase Details
Closed on
Mar 17, 1997
Sold by
Reed Mary E
Bought by
Manning David S
Create a Home Valuation Report for This Property
The Home Valuation Report is an in-depth analysis detailing your home's value as well as a comparison with similar homes in the area
Purchase History
| Date | Buyer | Sale Price | Title Company |
|---|---|---|---|
| Jeter Darrell K | $69,000 | -- | |
| Sanchez Joel | $42,000 | -- | |
| Manning David S | $37,000 | -- |
Source: Public Records
Mortgage History
| Date | Status | Borrower | Loan Amount |
|---|---|---|---|
| Open | Jeter Darrell K | $65,550 | |
| Previous Owner | Sanchez Joel | $39,900 |
Source: Public Records
Tax History
| Year | Tax Paid | Tax Assessment Tax Assessment Total Assessment is a certain percentage of the fair market value that is determined by local assessors to be the total taxable value of land and additions on the property. | Land | Improvement |
|---|---|---|---|---|
| 2025 | $992 | $10,939 | $961 | $9,978 |
| 2024 | $992 | $10,620 | $933 | $9,687 |
| 2023 | $960 | $10,311 | $908 | $9,403 |
| 2022 | $862 | $10,012 | $886 | $9,126 |
| 2021 | $880 | $9,719 | $843 | $8,876 |
| 2020 | $839 | $9,437 | $720 | $8,717 |
| 2019 | $819 | $9,438 | $720 | $8,718 |
| 2018 | $828 | $9,389 | $716 | $8,673 |
| 2017 | $742 | $9,116 | $695 | $8,421 |
| 2016 | $732 | $8,850 | $678 | $8,172 |
| 2015 | $583 | $8,593 | $360 | $8,233 |
| 2014 | $657 | $8,343 | $360 | $7,983 |
Source: Public Records
Map
Nearby Homes
- 414 Locust St
- 434 Locust St NW
- 1817 Comanche St
- 421 Elm St
- 1740 Tiverton St
- 1737 Winchester St
- 525 Cottonwood St
- 1908 Choctaw Ave
- 600 Cottonwood St
- 1618 Mount Washington Rd
- 510 Campbell St
- 11 Turner St
- 703 Cottonwood St
- 205 15th Ave NW
- 111 Lost Creek Ln
- 707 Maxwell St NW
- 45 15th Ave NW
- 0 15th Unit 2546881
- 412 Wandering Way
- 1722 Quiet Ln
Your Personal Tour Guide
Ask me questions while you tour the home.