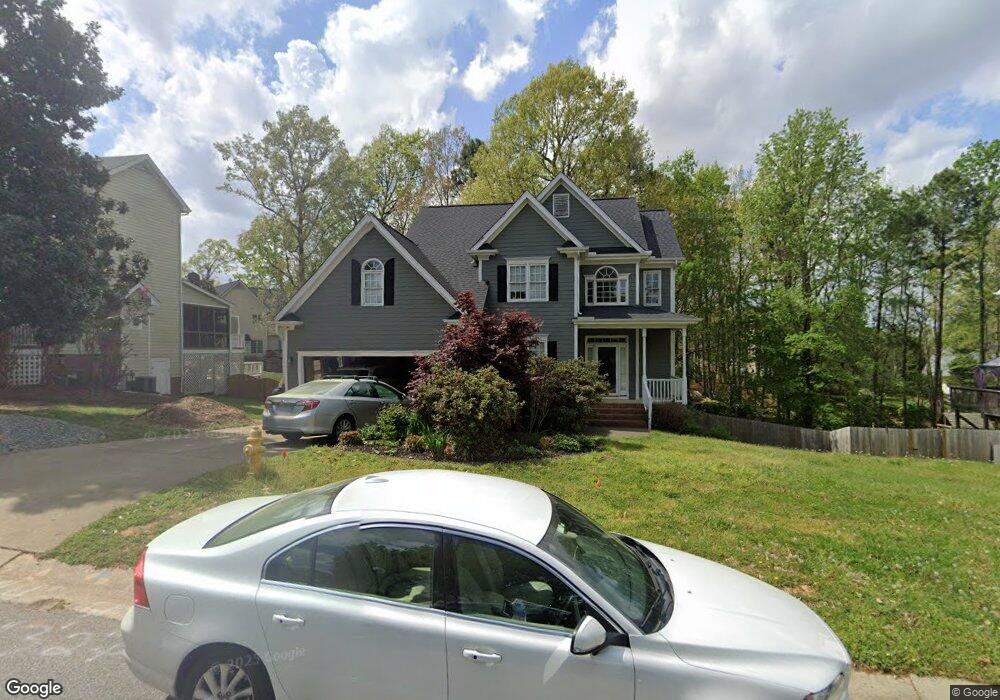
409 Oakhall Dr Holly Springs, NC 27540
Estimated Value: $479,000 - $511,000
3
Beds
3
Baths
2,072
Sq Ft
$239/Sq Ft
Est. Value
About This Home
This home is located at 409 Oakhall Dr, Holly Springs, NC 27540 and is currently estimated at $494,185, approximately $238 per square foot. 409 Oakhall Dr is a home located in Wake County with nearby schools including Oakview Elementary School, Apex Friendship Middle School, and Holly Springs High School.
Ownership History
Date
Name
Owned For
Owner Type
Purchase Details
Closed on
Mar 28, 2019
Sold by
Pacileo Ryan and Pacileo Candie
Bought by
Zhanna Maliukov Dmitrii and Zhanna Maliukova
Current Estimated Value
Home Financials for this Owner
Home Financials are based on the most recent Mortgage that was taken out on this home.
Original Mortgage
$300,457
Outstanding Balance
$265,213
Interest Rate
4.5%
Mortgage Type
FHA
Estimated Equity
$228,972
Purchase Details
Closed on
Jun 27, 2008
Sold by
Talotta Angela B and Talotta Frank A
Bought by
Pacileo Ryan and Pacileo Candie
Home Financials for this Owner
Home Financials are based on the most recent Mortgage that was taken out on this home.
Original Mortgage
$239,450
Interest Rate
5.97%
Mortgage Type
VA
Purchase Details
Closed on
Jul 11, 2002
Sold by
Shearin Gregory F
Bought by
Shearin Angela B
Home Financials for this Owner
Home Financials are based on the most recent Mortgage that was taken out on this home.
Original Mortgage
$70,000
Interest Rate
6.06%
Create a Home Valuation Report for This Property
The Home Valuation Report is an in-depth analysis detailing your home's value as well as a comparison with similar homes in the area
Home Values in the Area
Average Home Value in this Area
Purchase History
| Date | Buyer | Sale Price | Title Company |
|---|---|---|---|
| Zhanna Maliukov Dmitrii | $306,000 | None Available | |
| Pacileo Ryan | $232,500 | None Available | |
| Shearin Angela B | -- | -- |
Source: Public Records
Mortgage History
| Date | Status | Borrower | Loan Amount |
|---|---|---|---|
| Open | Zhanna Maliukov Dmitrii | $300,457 | |
| Previous Owner | Pacileo Ryan | $239,450 | |
| Previous Owner | Shearin Angela B | $70,000 |
Source: Public Records
Tax History Compared to Growth
Tax History
| Year | Tax Paid | Tax Assessment Tax Assessment Total Assessment is a certain percentage of the fair market value that is determined by local assessors to be the total taxable value of land and additions on the property. | Land | Improvement |
|---|---|---|---|---|
| 2025 | -- | $449,254 | $120,000 | $329,254 |
| 2024 | $3,824 | $443,892 | $120,000 | $323,892 |
| 2023 | $3,120 | $287,438 | $50,000 | $237,438 |
| 2022 | $3,013 | $287,438 | $50,000 | $237,438 |
| 2021 | $2,956 | $287,438 | $50,000 | $237,438 |
| 2020 | $2,956 | $287,438 | $50,000 | $237,438 |
| 2019 | $2,774 | $228,885 | $48,000 | $180,885 |
| 2018 | $2,508 | $228,885 | $48,000 | $180,885 |
| 2017 | $2,418 | $228,885 | $48,000 | $180,885 |
| 2016 | $2,384 | $228,885 | $48,000 | $180,885 |
| 2015 | $2,503 | $236,629 | $48,000 | $188,629 |
| 2014 | -- | $236,629 | $48,000 | $188,629 |
Source: Public Records
Map
Nearby Homes
- 713 Littleleaf Ct
- 725 Little Leaf Ct
- 717 Starkland Way
- 105 Townsgate Ct
- 108 Crabwall Ct
- 109 Bright Shade Ct
- 329 N Main St
- 321 Blalock St
- 318 Blalock St
- 737 W Holly Springs Rd
- 225 Douglas St
- 743 W Holly Springs Rd
- 749 W Holly Springs Rd
- 124 Cliffdale Rd
- 755 W Holly Springs Rd
- 761 W Holly Springs Rd
- 112 Burt St
- 105 Cross Hill Ln
- 321 Cross Hill Ln
- 112 Sanchez Ct
- 405 Oakhall Dr
- 413 Oakhall Dr
- 708 Little Leaf Ct
- 712 Little Leaf Ct
- 704 Little Leaf Ct
- 800 Silverstone Way
- 700 Little Leaf Ct
- 716 Little Leaf Ct
- 417 Oakhall Dr
- 716 Littleleaf Ct
- 121 Bracken Trail Cir
- 804 Silverstone Way
- 808 Chambord Way
- 804 Chambord Way
- 117 Bracken Trail Cir
- 720 Little Leaf Ct
- 808 Silverstone Way
- 701 Linden Ridge Dr
- 113 Bracken Trail Cir
- 705 Linden Ridge Dr