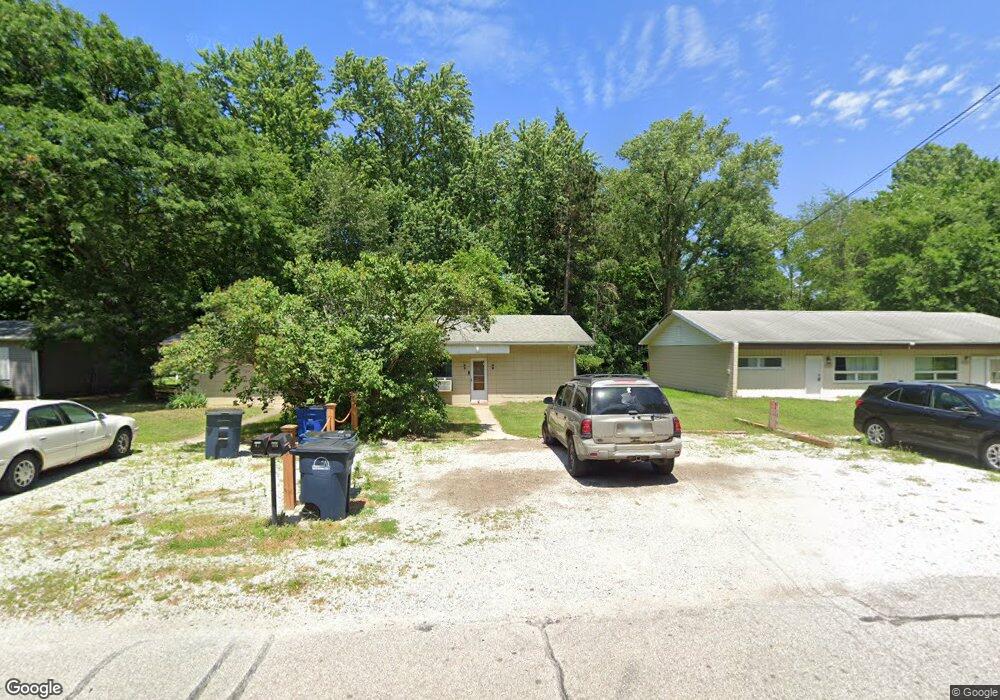
409 Ogden Ave Unit 411 Michigan City, IN 46360
Estimated Value: $132,812 - $184,000
4
Beds
2
Baths
1,456
Sq Ft
$107/Sq Ft
Est. Value
About This Home
This home is located at 409 Ogden Ave Unit 411, Michigan City, IN 46360 and is currently estimated at $156,453, approximately $107 per square foot. 409 Ogden Ave Unit 411 is a home located in LaPorte County with nearby schools including Knapp Elementary School, Barker Middle School, and Michigan City High School.
Ownership History
Date
Name
Owned For
Owner Type
Purchase Details
Closed on
Oct 5, 2022
Sold by
Sheriff Of Laporte County
Bought by
Karm Ronald J and Horizon Bank Na
Current Estimated Value
Purchase Details
Closed on
Aug 17, 2005
Sold by
Karm Ronald J
Bought by
Karm Ronald J
Home Financials for this Owner
Home Financials are based on the most recent Mortgage that was taken out on this home.
Original Mortgage
$75,390
Interest Rate
5.8%
Mortgage Type
Fannie Mae Freddie Mac
Create a Home Valuation Report for This Property
The Home Valuation Report is an in-depth analysis detailing your home's value as well as a comparison with similar homes in the area
Home Values in the Area
Average Home Value in this Area
Purchase History
| Date | Buyer | Sale Price | Title Company |
|---|---|---|---|
| Karm Ronald J | $100,100 | -- | |
| Karm Ronald J | -- | Ticor Title Insurance Co |
Source: Public Records
Mortgage History
| Date | Status | Borrower | Loan Amount |
|---|---|---|---|
| Previous Owner | Karm Ronald J | $75,390 |
Source: Public Records
Tax History Compared to Growth
Tax History
| Year | Tax Paid | Tax Assessment Tax Assessment Total Assessment is a certain percentage of the fair market value that is determined by local assessors to be the total taxable value of land and additions on the property. | Land | Improvement |
|---|---|---|---|---|
| 2024 | $2,130 | $83,700 | $16,200 | $67,500 |
| 2022 | $1,829 | $81,600 | $16,200 | $65,400 |
| 2021 | $1,829 | $76,400 | $16,200 | $60,200 |
| 2020 | $1,413 | $76,400 | $16,200 | $60,200 |
| 2019 | $1,286 | $59,400 | $22,900 | $36,500 |
| 2018 | $1,095 | $49,900 | $15,300 | $34,600 |
| 2017 | $857 | $38,000 | $12,100 | $25,900 |
| 2016 | $1,318 | $61,000 | $17,300 | $43,700 |
| 2014 | $1,187 | $59,200 | $10,600 | $48,600 |
Source: Public Records
Map
Nearby Homes