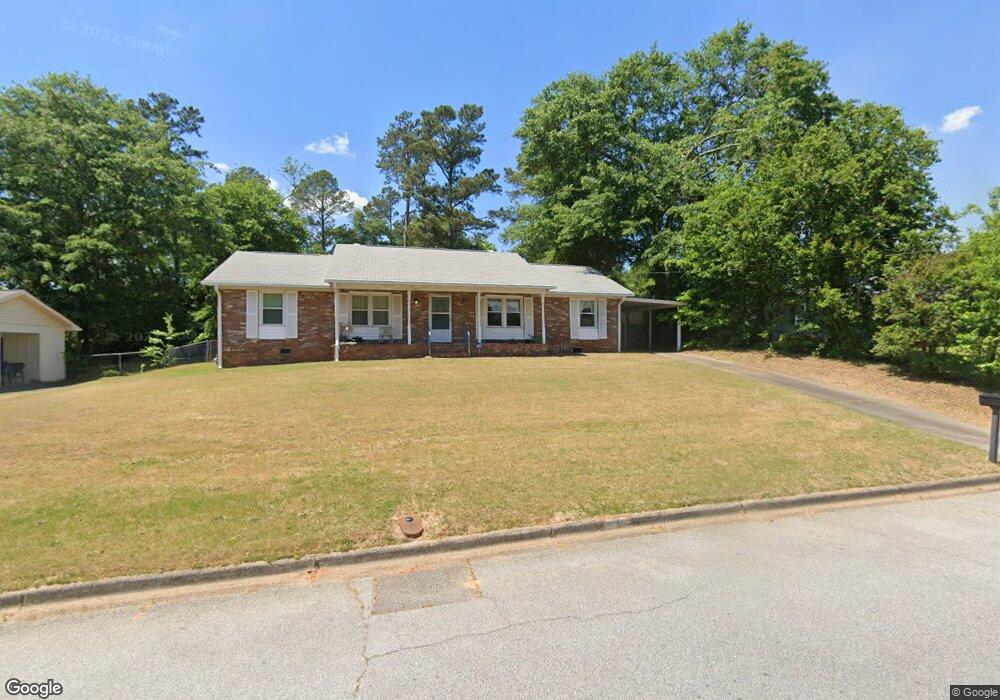
409 Parliament Rd Augusta, GA 30907
Estimated Value: $208,000 - $292,000
3
Beds
2
Baths
1,653
Sq Ft
$156/Sq Ft
Est. Value
About This Home
This home is located at 409 Parliament Rd, Augusta, GA 30907 and is currently estimated at $257,799, approximately $155 per square foot. 409 Parliament Rd is a home located in Columbia County with nearby schools including Stevens Creek Elementary School, Stallings Island Middle School, and Lakeside High School.
Ownership History
Date
Name
Owned For
Owner Type
Purchase Details
Closed on
Oct 15, 2024
Sold by
Nixon Holdings Llc
Bought by
Norman Ashton and Norman Jonathon
Current Estimated Value
Home Financials for this Owner
Home Financials are based on the most recent Mortgage that was taken out on this home.
Original Mortgage
$297,700
Outstanding Balance
$293,796
Interest Rate
6.09%
Mortgage Type
New Conventional
Estimated Equity
-$35,997
Purchase Details
Closed on
Jul 19, 2024
Sold by
Kjc Capital Llc
Bought by
Nixon Holdings Llc
Home Financials for this Owner
Home Financials are based on the most recent Mortgage that was taken out on this home.
Original Mortgage
$55,000
Interest Rate
6.87%
Mortgage Type
New Conventional
Purchase Details
Closed on
Mar 6, 2018
Sold by
Brown
Bought by
Kjc Capital Llc
Purchase Details
Closed on
Nov 9, 2010
Sold by
Brown Ronald Walter
Bought by
Brown Audrey Jean and Brown Ronald Wal
Create a Home Valuation Report for This Property
The Home Valuation Report is an in-depth analysis detailing your home's value as well as a comparison with similar homes in the area
Home Values in the Area
Average Home Value in this Area
Purchase History
| Date | Buyer | Sale Price | Title Company |
|---|---|---|---|
| Norman Ashton | $297,700 | -- | |
| Nixon Holdings Llc | $157,500 | -- | |
| Kjc Capital Llc | $80,000 | -- | |
| Brown Audrey Jean | -- | -- | |
| Brown Ronald Walter | -- | -- |
Source: Public Records
Mortgage History
| Date | Status | Borrower | Loan Amount |
|---|---|---|---|
| Open | Norman Ashton | $297,700 | |
| Previous Owner | Nixon Holdings Llc | $55,000 | |
| Previous Owner | Nixon Holdings Llc | $157,500 |
Source: Public Records
Tax History
| Year | Tax Paid | Tax Assessment Tax Assessment Total Assessment is a certain percentage of the fair market value that is determined by local assessors to be the total taxable value of land and additions on the property. | Land | Improvement |
|---|---|---|---|---|
| 2025 | $2,032 | $82,746 | $20,104 | $62,642 |
| 2024 | $1,955 | $75,878 | $20,104 | $55,774 |
| 2023 | $1,955 | $62,616 | $17,004 | $45,612 |
| 2022 | $1,519 | $56,196 | $14,004 | $42,192 |
| 2021 | $1,532 | $54,187 | $13,804 | $40,383 |
| 2020 | $1,495 | $51,732 | $13,104 | $38,628 |
| 2019 | $1,288 | $44,269 | $11,204 | $33,065 |
| 2018 | $1,516 | $52,309 | $13,204 | $39,105 |
| 2017 | $60 | $39,647 | $8,704 | $30,943 |
| 2016 | $60 | $38,147 | $7,580 | $30,567 |
| 2015 | $115 | $42,030 | $9,880 | $32,150 |
| 2014 | $60 | $37,306 | $9,880 | $27,426 |
Source: Public Records
Map
Nearby Homes
- 414 Parliament Rd
- 320 Furys Ferry Rd
- 345 Old Salem Way
- 321 Sally Dr
- 204 &205 Angela Dr
- 705 Cool Brook Ct
- 429 Wexford Ct
- 309 Old Salem Way
- 716 Cool Brook Dr
- 304 Old Salem Way
- 3667 Foxfire Place
- 308 Valhalla Ct
- 719 Gentlewind Ln
- 248 Watervale Rd
- 316 Wakefield Ln N
- 3750 Roscommon S
- 315 Rabun Valley Ln
- 4120 Shady Oaks Dr
- 3613 Lake Shore Dr
- 317 Furys Ferry Rd
- 411 Parliament Rd
- 407 Parliament Rd
- 421 Parliament Place
- 413 Parliament Rd
- 419 Parliament Place
- 408 Parliament Rd
- 406 Parliament Rd
- 423 Parliament Place
- 3602 Parliament Ln
- 405 Parliament Rd
- 417 Parliament Place
- 3604 Parliament Ln
- 412 Parliament Rd
- 404 Parliament Rd
- 3597 Marlboro Way
- 3598 Parliament Ln
- 415 Parliament Rd
- 3606 Parliament Ln
- 3598 Marlboro Way
- 3596 Parliament Ln
Your Personal Tour Guide
Ask me questions while you tour the home.