Estimated Value: $255,000 - $311,000
3
Beds
2
Baths
1,576
Sq Ft
$175/Sq Ft
Est. Value
About This Home
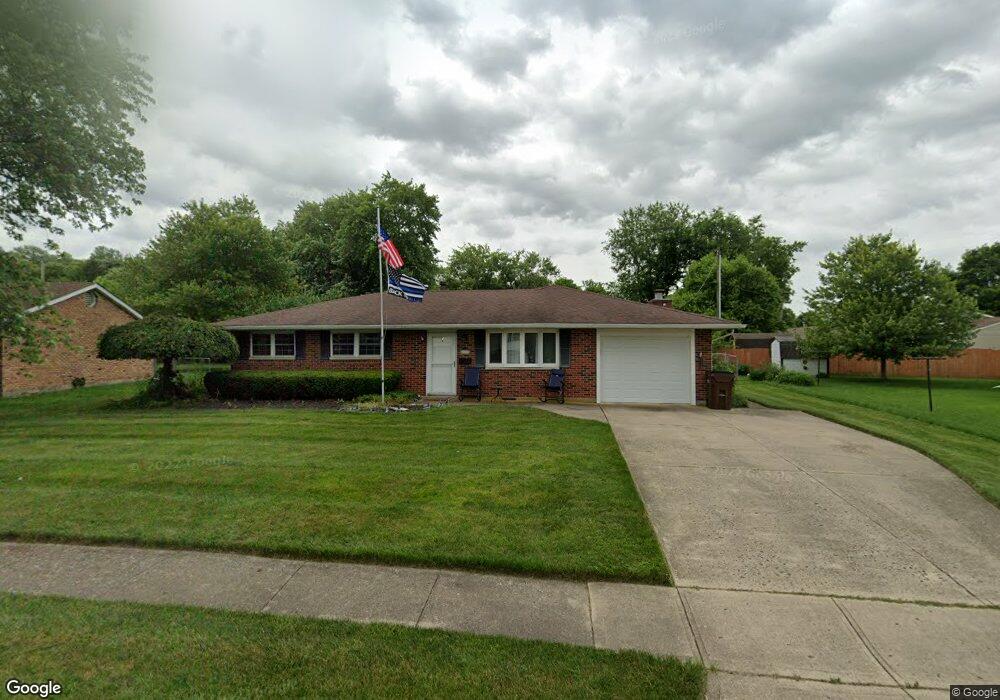
This home is located at 409 Redbud Ln, Xenia, OH 45385 and is currently estimated at $276,232, approximately $175 per square foot. 409 Redbud Ln is a home located in Greene County with nearby schools including Xenia High School, Summit Academy Community School for Alternative Learners - Xenia, and Legacy Christian Academy.
Ownership History
Date
Name
Owned For
Owner Type
Purchase Details
Closed on
Sep 11, 2017
Sold by
Russ Kevin A and Russ Nicole M
Bought by
Foster Jacquelyn M
Current Estimated Value
Purchase Details
Closed on
Jun 13, 2017
Sold by
Foster Jackie M
Bought by
Russ Kevin A and Russ Nicole M
Purchase Details
Closed on
Nov 1, 2006
Sold by
Fischer Eugene C and Fischer Gail L
Bought by
Russ Kevin A and Russ Nicole M
Home Financials for this Owner
Home Financials are based on the most recent Mortgage that was taken out on this home.
Original Mortgage
$138,655
Interest Rate
6.45%
Mortgage Type
FHA
Create a Home Valuation Report for This Property
The Home Valuation Report is an in-depth analysis detailing your home's value as well as a comparison with similar homes in the area
Home Values in the Area
Average Home Value in this Area
Purchase History
| Date | Buyer | Sale Price | Title Company |
|---|---|---|---|
| Foster Jacquelyn M | $165,000 | Hallmark Title | |
| Russ Kevin A | -- | None Available | |
| Russ Kevin A | $139,900 | Attorney |
Source: Public Records
Mortgage History
| Date | Status | Borrower | Loan Amount |
|---|---|---|---|
| Previous Owner | Russ Kevin A | $138,655 |
Source: Public Records
Tax History Compared to Growth
Tax History
| Year | Tax Paid | Tax Assessment Tax Assessment Total Assessment is a certain percentage of the fair market value that is determined by local assessors to be the total taxable value of land and additions on the property. | Land | Improvement |
|---|---|---|---|---|
| 2024 | $2,734 | $65,500 | $13,120 | $52,380 |
| 2023 | $2,734 | $65,500 | $13,120 | $52,380 |
| 2022 | $2,363 | $48,260 | $8,200 | $40,060 |
| 2021 | $2,395 | $48,260 | $8,200 | $40,060 |
| 2020 | $2,292 | $48,260 | $8,200 | $40,060 |
| 2019 | $2,533 | $50,210 | $8,440 | $41,770 |
| 2018 | $2,543 | $50,240 | $8,440 | $41,800 |
| 2017 | $2,315 | $50,240 | $8,440 | $41,800 |
| 2016 | $2,315 | $44,880 | $8,440 | $36,440 |
| 2015 | $2,322 | $44,880 | $8,440 | $36,440 |
| 2014 | $2,135 | $43,130 | $8,440 | $34,690 |
Source: Public Records
Map
Nearby Homes
- 508 Marshall Dr
- 479 N Stadium Dr
- 568 Louise Dr
- 513 Redbud Ln
- 348 S Stadium Dr
- 610 Saxony Dr
- 656 Eden Roc Dr
- 119 Park Dr
- 659 N King St
- 516 N King St
- 878 N Detroit St
- 645 E Church St
- 902 N Detroit St
- 612 E Market St
- 137 Pleasant St
- 1038 Frederick Dr
- 613 N West St
- 541 E Main St
- 607 E Main St
- 1171 N Detroit St