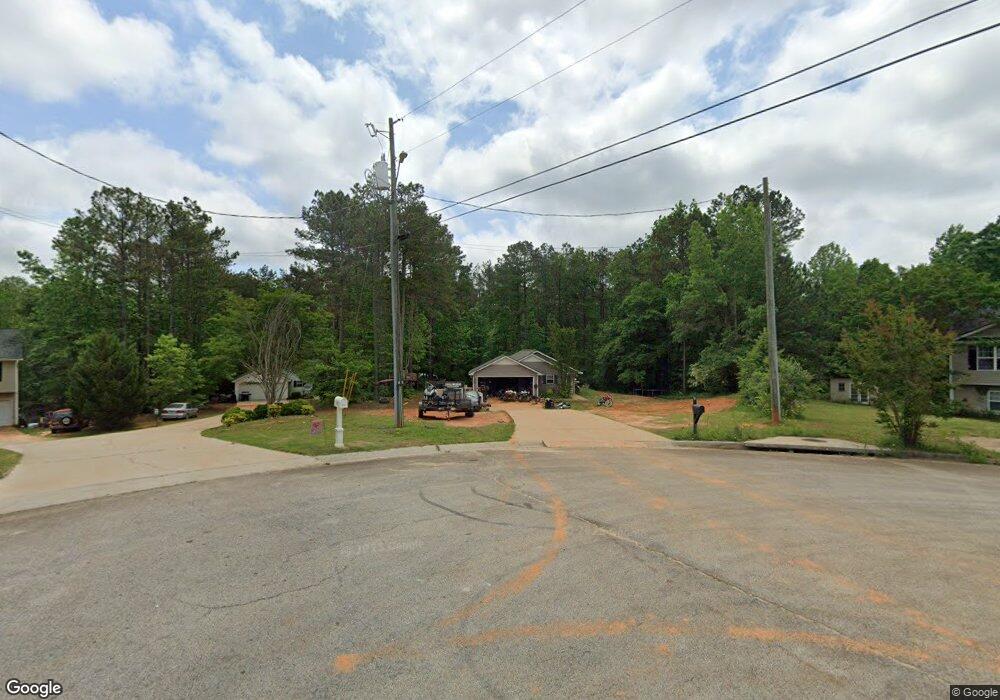
409 Reids Mill Way Carrollton, GA 30116
Estimated Value: $243,000 - $273,000
3
Beds
2
Baths
1,376
Sq Ft
$188/Sq Ft
Est. Value
About This Home
This home is located at 409 Reids Mill Way, Carrollton, GA 30116 and is currently estimated at $258,637, approximately $187 per square foot. 409 Reids Mill Way is a home located in Carroll County with nearby schools including Central Elementary School, Central Middle School, and Central High School.
Ownership History
Date
Name
Owned For
Owner Type
Purchase Details
Closed on
Jan 11, 2019
Sold by
Holt John
Bought by
Hopkins David E
Current Estimated Value
Purchase Details
Closed on
Mar 10, 2008
Sold by
Colonial Bank
Bought by
Holt John
Purchase Details
Closed on
Nov 6, 2007
Sold by
Not Provided
Bought by
Holt John
Purchase Details
Closed on
Oct 22, 2004
Sold by
Mcdowell Dennis H
Bought by
Ledbetter Gregg F
Purchase Details
Closed on
Apr 29, 2004
Bought by
Mcdowell Dennis H
Create a Home Valuation Report for This Property
The Home Valuation Report is an in-depth analysis detailing your home's value as well as a comparison with similar homes in the area
Home Values in the Area
Average Home Value in this Area
Purchase History
| Date | Buyer | Sale Price | Title Company |
|---|---|---|---|
| Hopkins David E | $129,900 | -- | |
| Holt John | $70,000 | -- | |
| Holt John | $111,194 | -- | |
| Ledbetter Gregg F | $26,000 | -- | |
| Ledbetter Gregg F | $26,000 | -- | |
| Mcdowell Dennis H | -- | -- |
Source: Public Records
Tax History Compared to Growth
Tax History
| Year | Tax Paid | Tax Assessment Tax Assessment Total Assessment is a certain percentage of the fair market value that is determined by local assessors to be the total taxable value of land and additions on the property. | Land | Improvement |
|---|---|---|---|---|
| 2024 | $2,074 | $91,689 | $7,400 | $84,289 |
| 2023 | $2,074 | $84,051 | $7,400 | $76,651 |
| 2022 | $1,693 | $67,484 | $6,000 | $61,484 |
| 2021 | $1,505 | $58,719 | $6,000 | $52,719 |
| 2020 | $1,334 | $52,327 | $6,000 | $46,327 |
| 2019 | $1,265 | $48,874 | $6,000 | $42,874 |
| 2018 | $1,006 | $38,300 | $4,000 | $34,300 |
| 2017 | $1,009 | $38,300 | $4,000 | $34,300 |
| 2016 | $895 | $38,300 | $4,000 | $34,300 |
| 2015 | $969 | $34,655 | $4,000 | $30,656 |
| 2014 | $844 | $30,057 | $4,000 | $26,057 |
Source: Public Records
Map
Nearby Homes
- 1432 Eagles Nest Cir
- 1281 Eagles Nest Cir
- 149 Hawk Ln
- 870 Eagles Nest Cir
- 1137 Eagles Nest Cir
- 1265 Horsley Mill Rd
- 100 Eldorado Dr
- 116 Camilla Dr
- 1005 Oak Mountain Rd
- 75 Timber Mill Cir
- 214 Asher Dr
- 240 Knob Dr
- 912 Folds Rd
- 103 Birkdale Blvd
- 103 Hilo Ct
- 205 Turnberry Cir
- 690 Horsley Mill Rd
- 680 Horsley Mill Rd
- 412 Reids Mill Way
- 408 Reids Mill Way
- 245 Christian Cir
- 246 Ruby Ct
- 252 Ruby Ct
- 249 Christian Cir
- 241 Christian Cir
- 565 Eagles Nest Cir
- 251 Christian Cir
- 0 Reids Mill Way
- 234 Ruby Ct
- 0 Ruby Ct Unit 7456561
- 0 Ruby Ct Unit 7101158
- 0 Ruby Ct Unit 7078259
- 0 Ruby Ct Unit 8865924
- 0 Ruby Ct Unit 8172958
- 545 Eagles Nest Cir
- 255 Ruby Ct
- 124 Rulon Ct Unit 51
- 124 Rulon Ct