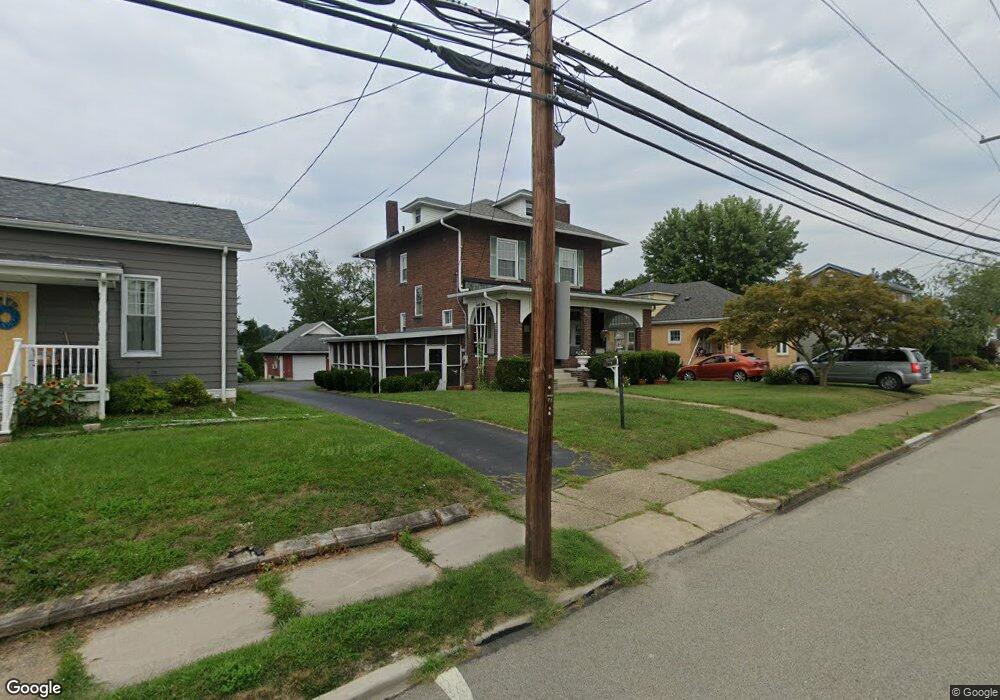
409 Ridge Ave Canonsburg, PA 15317
Estimated Value: $221,000 - $282,759
4
Beds
1
Bath
2,285
Sq Ft
$111/Sq Ft
Est. Value
About This Home
This home is located at 409 Ridge Ave, Canonsburg, PA 15317 and is currently estimated at $254,190, approximately $111 per square foot. 409 Ridge Ave is a home located in Washington County with nearby schools including Canon-Mcmillan Senior High School and Central Christian Academy.
Ownership History
Date
Name
Owned For
Owner Type
Purchase Details
Closed on
Jun 12, 2024
Sold by
Bissell Carla S and Bissell William John
Bought by
Bissell Carla S
Current Estimated Value
Purchase Details
Closed on
Sep 29, 2021
Sold by
Adams David D and Hagan Christina T
Bought by
Bissell Carla S and Bissell William John
Home Financials for this Owner
Home Financials are based on the most recent Mortgage that was taken out on this home.
Original Mortgage
$140,000
Interest Rate
2.8%
Mortgage Type
New Conventional
Purchase Details
Closed on
Nov 1, 2019
Sold by
Gowern Eileen H
Bought by
Adams David D and Hagan Christina T
Home Financials for this Owner
Home Financials are based on the most recent Mortgage that was taken out on this home.
Original Mortgage
$172,511
Interest Rate
2.8%
Mortgage Type
VA
Create a Home Valuation Report for This Property
The Home Valuation Report is an in-depth analysis detailing your home's value as well as a comparison with similar homes in the area
Home Values in the Area
Average Home Value in this Area
Purchase History
| Date | Buyer | Sale Price | Title Company |
|---|---|---|---|
| Bissell Carla S | -- | None Listed On Document | |
| Bissell Carla S | $210,000 | Keymax Settlement Svcs Llc | |
| Adams David D | $167,000 | Platinum Setmnt & Escrow Inc |
Source: Public Records
Mortgage History
| Date | Status | Borrower | Loan Amount |
|---|---|---|---|
| Previous Owner | Bissell Carla S | $140,000 | |
| Previous Owner | Adams David D | $172,511 |
Source: Public Records
Tax History Compared to Growth
Tax History
| Year | Tax Paid | Tax Assessment Tax Assessment Total Assessment is a certain percentage of the fair market value that is determined by local assessors to be the total taxable value of land and additions on the property. | Land | Improvement |
|---|---|---|---|---|
| 2025 | $3,084 | $151,400 | $32,400 | $119,000 |
| 2024 | $2,873 | $151,400 | $32,400 | $119,000 |
| 2023 | $2,873 | $151,400 | $32,400 | $119,000 |
| 2022 | $2,866 | $151,400 | $32,400 | $119,000 |
| 2021 | $2,836 | $151,400 | $32,400 | $119,000 |
| 2020 | $2,775 | $151,400 | $32,400 | $119,000 |
| 2019 | $2,690 | $151,400 | $32,400 | $119,000 |
| 2018 | $2,643 | $151,400 | $32,400 | $119,000 |
| 2017 | $581 | $151,400 | $32,400 | $119,000 |
| 2016 | $897 | $13,962 | $2,527 | $11,435 |
| 2015 | $549 | $13,962 | $2,527 | $11,435 |
| 2014 | $2,245 | $13,962 | $2,527 | $11,435 |
| 2013 | $2,245 | $13,962 | $2,527 | $11,435 |
Source: Public Records
Map
Nearby Homes
- 16 Chestnut St
- 409 N Jefferson Ave
- 337 N Jefferson Ave
- 407 Greenside Ave
- 233 Valley Rd
- 438 Canyon Dr
- 221 Belmont Ave
- 31 W College St
- 217 Belmont Ave
- 126 Church Way
- 556 Tannehill St
- 129 N Jefferson Ave
- 137 Vine St
- 126 Vine St
- 215 Smithfield St
- Lot 69 Smithfield St
- 142 Vine St
- 218 E Pitt St
- 1137 1st St
- 504 Tannehill St
- 409 Ridge Ave
- 405 Ridge Ave
- 411 Ridge Ave
- 401 Ridge Ave
- 16 Chestnut St
- 417 Ridge Ave
- 419 Ridge Ave
- 410 N Jefferson Ave
- 367 Ridge Ave
- 408 N Jefferson Ave
- 412 N Jefferson Ave
- 427 Ridge Ave
- 24 Chestnut St
- 24 Chestnut St
- 404 N Jefferson Ave
- 365 Ridge Ave
- 21 Chestnut St
- 416 Ridge Ave
- 414 N Jefferson Ave
- 410 Ridge Ave