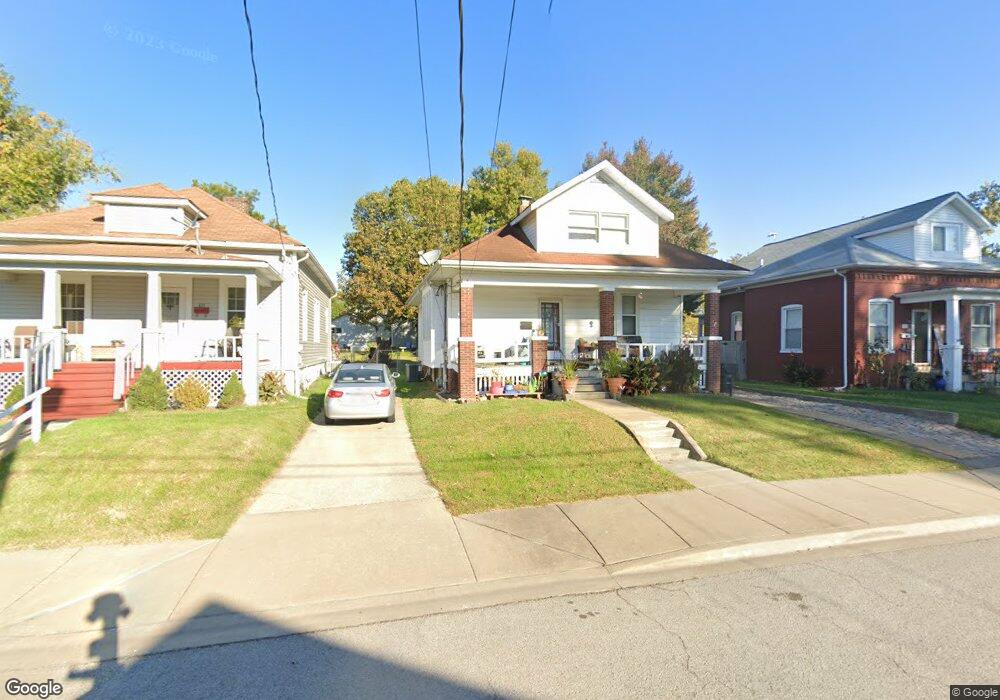
409 S 10th St Belleville, IL 62220
Estimated Value: $115,000 - $167,000
3
Beds
2
Baths
1,496
Sq Ft
$99/Sq Ft
Est. Value
About This Home
This home is located at 409 S 10th St, Belleville, IL 62220 and is currently estimated at $148,633, approximately $99 per square foot. 409 S 10th St is a home located in St. Clair County with nearby schools including Henry Raab Elementary School, Central Jr High School, and Governor French Academy.
Ownership History
Date
Name
Owned For
Owner Type
Purchase Details
Closed on
Nov 21, 2024
Sold by
Blair Tanna Leigh and Corianne Blair Estate Corianne Blair Estate
Bought by
Blair Tanna
Current Estimated Value
Purchase Details
Closed on
May 26, 2009
Sold by
Lowe Kerry S
Bought by
Blair Corianne R
Home Financials for this Owner
Home Financials are based on the most recent Mortgage that was taken out on this home.
Original Mortgage
$111,935
Outstanding Balance
$70,989
Interest Rate
4.84%
Mortgage Type
FHA
Estimated Equity
$77,644
Purchase Details
Closed on
Jul 2, 2007
Sold by
Caponi Michael F and Caponi Jacqueline M
Bought by
Lowe Kerry S
Create a Home Valuation Report for This Property
The Home Valuation Report is an in-depth analysis detailing your home's value as well as a comparison with similar homes in the area
Home Values in the Area
Average Home Value in this Area
Purchase History
| Date | Buyer | Sale Price | Title Company |
|---|---|---|---|
| Blair Tanna | -- | None Available | |
| Blair Corianne R | $114,000 | Fatic | |
| Lowe Kerry S | $117,000 | Fatic |
Source: Public Records
Mortgage History
| Date | Status | Borrower | Loan Amount |
|---|---|---|---|
| Open | Blair Corianne R | $111,935 |
Source: Public Records
Tax History Compared to Growth
Tax History
| Year | Tax Paid | Tax Assessment Tax Assessment Total Assessment is a certain percentage of the fair market value that is determined by local assessors to be the total taxable value of land and additions on the property. | Land | Improvement |
|---|---|---|---|---|
| 2024 | $2,916 | $39,158 | $4,144 | $35,014 |
| 2023 | $2,840 | $36,254 | $4,062 | $32,192 |
| 2022 | $2,550 | $32,638 | $3,657 | $28,981 |
| 2021 | $2,410 | $30,173 | $3,381 | $26,792 |
| 2020 | $2,317 | $28,533 | $3,197 | $25,336 |
| 2019 | $2,357 | $28,749 | $3,201 | $25,548 |
| 2018 | $2,291 | $28,128 | $3,132 | $24,996 |
| 2017 | $2,275 | $27,930 | $3,110 | $24,820 |
| 2016 | $2,240 | $27,337 | $3,044 | $24,293 |
| 2014 | $1,801 | $25,479 | $3,304 | $22,175 |
| 2013 | $1,832 | $25,843 | $3,351 | $22,492 |
Source: Public Records
Map
Nearby Homes