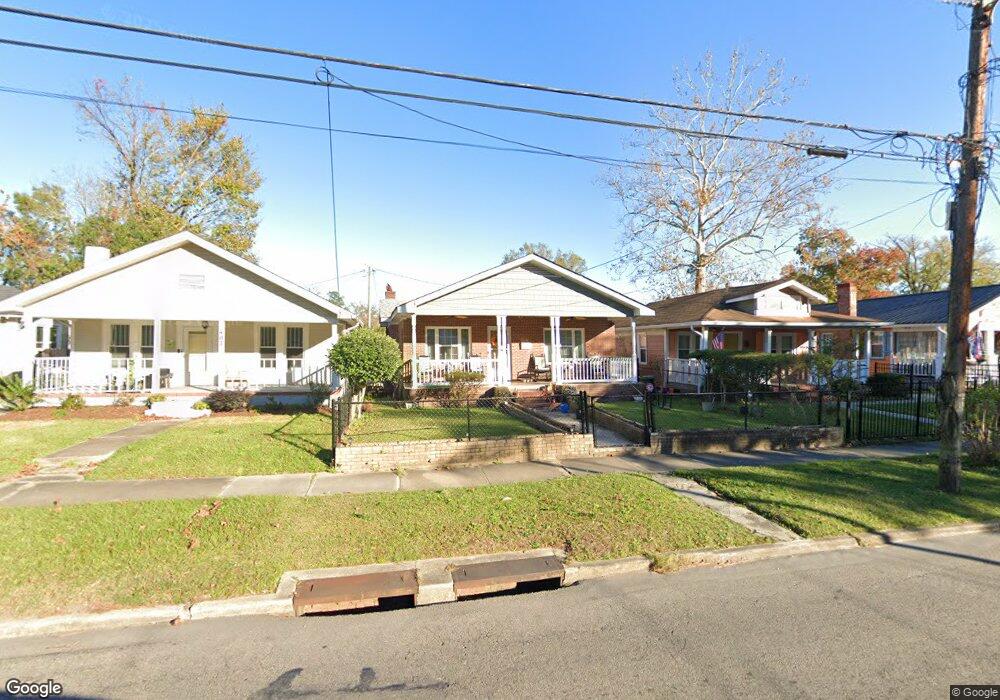
409 S 16th St Wilmington, NC 28401
The Bottom NeighborhoodEstimated Value: $270,000 - $282,000
2
Beds
1
Bath
961
Sq Ft
$286/Sq Ft
Est. Value
About This Home
This home is located at 409 S 16th St, Wilmington, NC 28401 and is currently estimated at $275,323, approximately $286 per square foot. 409 S 16th St is a home located in New Hanover County with nearby schools including Snipes Academy of Arts & Design, Williston Middle School, and John T. Hoggard High School.
Ownership History
Date
Name
Owned For
Owner Type
Purchase Details
Closed on
Apr 14, 2025
Sold by
Stringfield Esta
Bought by
Stringfield Esta
Current Estimated Value
Purchase Details
Closed on
Mar 7, 2001
Sold by
Cromartie Carl E
Bought by
Simpson Reginald
Purchase Details
Closed on
Mar 2, 2001
Sold by
Simpson Thelma Young
Bought by
Cromartie Carl E
Purchase Details
Closed on
Feb 10, 1984
Sold by
Simpson Elisha
Bought by
Simpson Thelma
Purchase Details
Closed on
Jan 7, 1963
Bought by
Simpson Elisha Thelma
Create a Home Valuation Report for This Property
The Home Valuation Report is an in-depth analysis detailing your home's value as well as a comparison with similar homes in the area
Home Values in the Area
Average Home Value in this Area
Purchase History
| Date | Buyer | Sale Price | Title Company |
|---|---|---|---|
| Stringfield Esta | -- | None Listed On Document | |
| Stringfield Esta | -- | None Listed On Document | |
| Simpson Reginald | -- | -- | |
| Cromartie Carl E | -- | -- | |
| Simpson Thelma | -- | -- | |
| Simpson Elisha Thelma | -- | -- |
Source: Public Records
Tax History Compared to Growth
Tax History
| Year | Tax Paid | Tax Assessment Tax Assessment Total Assessment is a certain percentage of the fair market value that is determined by local assessors to be the total taxable value of land and additions on the property. | Land | Improvement |
|---|---|---|---|---|
| 2025 | $1,286 | $319,300 | $83,800 | $235,500 |
| 2024 | $1,286 | $147,800 | $53,900 | $93,900 |
| 2023 | $1,286 | $147,800 | $53,900 | $93,900 |
| 2022 | $628 | $147,800 | $53,900 | $93,900 |
| 2021 | $632 | $147,800 | $53,900 | $93,900 |
| 2020 | $528 | $100,200 | $31,400 | $68,800 |
| 2019 | $528 | $100,200 | $31,400 | $68,800 |
| 2018 | $528 | $100,200 | $31,400 | $68,800 |
| 2017 | $528 | $100,200 | $31,400 | $68,800 |
| 2016 | $432 | $77,900 | $27,200 | $50,700 |
| 2015 | $412 | $77,900 | $27,200 | $50,700 |
| 2014 | $395 | $77,900 | $27,200 | $50,700 |
Source: Public Records
Map
Nearby Homes