Estimated Value: $410,000 - $459,000
3
Beds
3
Baths
2,506
Sq Ft
$172/Sq Ft
Est. Value
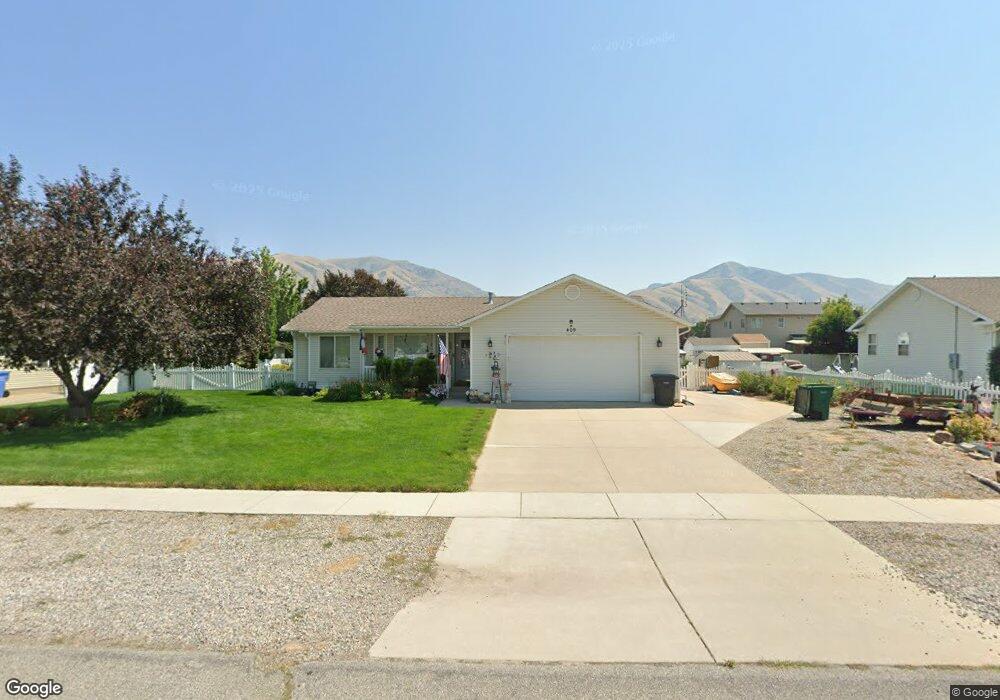
About This Home
This home is located at 409 S 675 E, Hyrum, UT 84319 and is currently estimated at $430,050, approximately $171 per square foot. 409 S 675 E is a home located in Cache County with nearby schools including Millville School, South Cache Middle School, and Mountain Crest High School.
Ownership History
Date
Name
Owned For
Owner Type
Purchase Details
Closed on
Feb 23, 2022
Sold by
Ljm Utah Properties Llc
Bought by
Masco Revocable Trust
Current Estimated Value
Purchase Details
Closed on
Jan 23, 2017
Sold by
Leavenworth Harry E and Leavenworth Claudia J
Bought by
Ljm Utah Properties Llc
Purchase Details
Closed on
May 11, 2010
Sold by
Leavenworth Harry and Leavenworth Claudia
Bought by
Leavenworth Harry E and Leavenworth Claudia J
Create a Home Valuation Report for This Property
The Home Valuation Report is an in-depth analysis detailing your home's value as well as a comparison with similar homes in the area
Home Values in the Area
Average Home Value in this Area
Purchase History
| Date | Buyer | Sale Price | Title Company |
|---|---|---|---|
| Masco Revocable Trust | -- | Smith M Robert | |
| Masco Revocable Trust | -- | Smith M Robert | |
| Ljm Utah Properties Llc | -- | American Secure Title | |
| Leavenworth Harry E | -- | None Available |
Source: Public Records
Tax History
| Year | Tax Paid | Tax Assessment Tax Assessment Total Assessment is a certain percentage of the fair market value that is determined by local assessors to be the total taxable value of land and additions on the property. | Land | Improvement |
|---|---|---|---|---|
| 2025 | $1,542 | $221,340 | $0 | $0 |
| 2024 | $1,642 | $220,230 | $0 | $0 |
| 2023 | $1,646 | $210,980 | $0 | $0 |
| 2022 | $1,717 | $210,980 | $0 | $0 |
| 2021 | $169 | $319,885 | $65,050 | $254,835 |
| 2020 | $1,583 | $281,238 | $65,050 | $216,188 |
| 2019 | $1,545 | $258,188 | $42,000 | $216,188 |
| 2018 | $1,424 | $229,990 | $42,000 | $187,990 |
| 2017 | $1,397 | $117,095 | $0 | $0 |
| 2016 | $1,429 | $98,340 | $0 | $0 |
| 2015 | $1,108 | $90,560 | $0 | $0 |
| 2014 | $1,070 | $89,455 | $0 | $0 |
| 2013 | -- | $89,455 | $0 | $0 |
Source: Public Records
Map
Nearby Homes
Your Personal Tour Guide
Ask me questions while you tour the home.