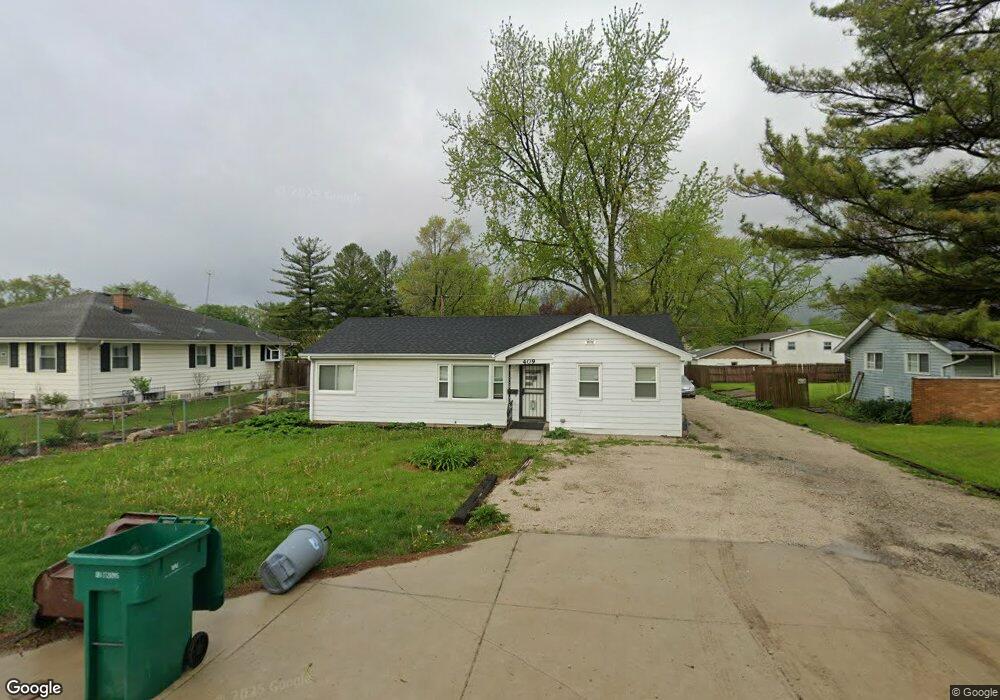
409 S Briggs St Joliet, IL 60433
Southeast Joliet NeighborhoodEstimated Value: $75,000 - $223,000
3
Beds
--
Bath
768
Sq Ft
$207/Sq Ft
Est. Value
About This Home
This home is located at 409 S Briggs St, Joliet, IL 60433 and is currently estimated at $159,187, approximately $207 per square foot. 409 S Briggs St is a home located in Will County with nearby schools including T.E. Culbertson Elementary School, Washington Jr. High School and Academy, and Joliet Central High School.
Ownership History
Date
Name
Owned For
Owner Type
Purchase Details
Closed on
Nov 19, 2024
Sold by
Olderr Michael C
Bought by
Vb Investments Llc
Current Estimated Value
Home Financials for this Owner
Home Financials are based on the most recent Mortgage that was taken out on this home.
Original Mortgage
$119,175
Outstanding Balance
$20,337
Interest Rate
5.71%
Mortgage Type
Construction
Estimated Equity
$138,850
Purchase Details
Closed on
Jul 16, 2001
Sold by
Aslton Brandon R and Pena Alicia M
Bought by
Olderr Michael C
Home Financials for this Owner
Home Financials are based on the most recent Mortgage that was taken out on this home.
Original Mortgage
$103,020
Interest Rate
7.16%
Mortgage Type
VA
Purchase Details
Closed on
Jul 30, 1996
Sold by
Bean David L and Bean Leanna L
Bought by
Alston Brandon R and Pena Alicia M
Home Financials for this Owner
Home Financials are based on the most recent Mortgage that was taken out on this home.
Original Mortgage
$75,900
Interest Rate
8.33%
Create a Home Valuation Report for This Property
The Home Valuation Report is an in-depth analysis detailing your home's value as well as a comparison with similar homes in the area
Home Values in the Area
Average Home Value in this Area
Purchase History
| Date | Buyer | Sale Price | Title Company |
|---|---|---|---|
| Vb Investments Llc | $75,500 | Fidelity National Title Insura | |
| Vb Investments Llc | $75,500 | Fidelity National Title Insura | |
| Olderr Michael C | $101,000 | Ticor Title | |
| Alston Brandon R | $80,000 | -- |
Source: Public Records
Mortgage History
| Date | Status | Borrower | Loan Amount |
|---|---|---|---|
| Open | Vb Investments Llc | $119,175 | |
| Closed | Vb Investments Llc | $119,175 | |
| Previous Owner | Olderr Michael C | $103,020 | |
| Previous Owner | Alston Brandon R | $75,900 |
Source: Public Records
Tax History Compared to Growth
Tax History
| Year | Tax Paid | Tax Assessment Tax Assessment Total Assessment is a certain percentage of the fair market value that is determined by local assessors to be the total taxable value of land and additions on the property. | Land | Improvement |
|---|---|---|---|---|
| 2024 | $3,362 | $48,025 | $18,705 | $29,320 |
| 2023 | $3,362 | $42,670 | $16,619 | $26,051 |
| 2022 | $3,053 | $38,598 | $15,033 | $23,565 |
| 2021 | $2,872 | $36,049 | $14,040 | $22,009 |
| 2020 | $2,714 | $34,234 | $13,333 | $20,901 |
| 2019 | $2,512 | $31,816 | $12,391 | $19,425 |
| 2018 | $2,285 | $28,550 | $11,109 | $17,441 |
| 2017 | $2,109 | $25,957 | $10,100 | $15,857 |
| 2016 | $1,950 | $23,697 | $9,274 | $14,423 |
| 2015 | $1,841 | $22,300 | $8,750 | $13,550 |
| 2014 | $1,841 | $22,200 | $8,700 | $13,500 |
| 2013 | $1,841 | $24,023 | $9,678 | $14,345 |
Source: Public Records
Map
Nearby Homes
- 302 S Briggs St
- 120 Anderson Ave
- 106 Hillsdale Rd
- 4 Peale St
- 2 Peale St
- 810 Peale St
- 137 Independence Ave
- 111 Court St
- 309 SE Circle Dr
- 0 Hermans Ln
- 2116 Hanover St
- 1602 E Cass St
- 2202 E Washington St
- 806 Spencer St
- 1858 David Ave
- Lot Spencer Rd
- 824 Harlow Ave
- 110 Arizona Ave
- 330 Harwood St
- 618 Florence Ave
- 405 S Briggs St
- 1525 5th Ave
- 1523 5th Ave
- 418 Siegmund St
- 401 S Briggs St
- 401 S Briggs St Unit 2
- 401 S Briggs St Unit 1
- 410 S Briggs St
- 404 S Briggs St
- 412 S Briggs St
- 416 Siegmund St
- 501 S Briggs St
- 400 S Briggs St
- 416 S Briggs St
- 319 S Briggs St
- 415 S Briggs St
- 317 S Briggs St
- 419 Siegmund St
- 409 Davison St
- 502 Siegmund St