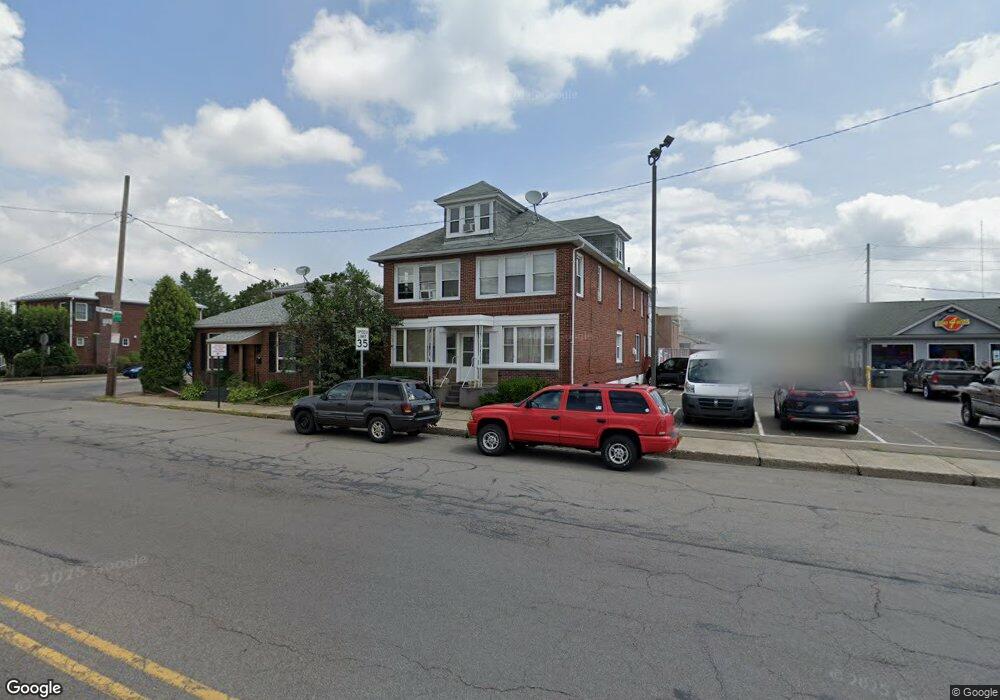
409 S Poplar St Hazleton, PA 18201
Estimated Value: $179,000 - $369,000
3
Beds
2
Baths
1,200
Sq Ft
$251/Sq Ft
Est. Value
About This Home
This home is located at 409 S Poplar St, Hazleton, PA 18201 and is currently estimated at $301,566, approximately $251 per square foot. 409 S Poplar St is a home located in Luzerne County with nearby schools including Hazleton Area High School, Holy Family Academy, and Immanuel Christian School.
Ownership History
Date
Name
Owned For
Owner Type
Purchase Details
Closed on
Jul 2, 2021
Sold by
Dougherty Maureen Chapman
Bought by
R & G Real Comm Inc
Current Estimated Value
Purchase Details
Closed on
Jul 18, 2018
Sold by
Usa Estates Llc
Bought by
Dougherty Maureen Chapman
Purchase Details
Closed on
Nov 18, 2016
Sold by
Dougherty Maureen Chapman
Bought by
Buford Erika M
Purchase Details
Closed on
Mar 19, 2013
Sold by
Dougherty William G
Bought by
Dougherty Maureen Chapman
Create a Home Valuation Report for This Property
The Home Valuation Report is an in-depth analysis detailing your home's value as well as a comparison with similar homes in the area
Home Values in the Area
Average Home Value in this Area
Purchase History
| Date | Buyer | Sale Price | Title Company |
|---|---|---|---|
| R & G Real Comm Inc | $230,000 | None Available | |
| Dougherty Maureen Chapman | -- | None Available | |
| Buford Erika M | $78,000 | None Available | |
| Dougherty Maureen Chapman | -- | None Available |
Source: Public Records
Tax History Compared to Growth
Tax History
| Year | Tax Paid | Tax Assessment Tax Assessment Total Assessment is a certain percentage of the fair market value that is determined by local assessors to be the total taxable value of land and additions on the property. | Land | Improvement |
|---|---|---|---|---|
| 2025 | $4,113 | $143,200 | $39,300 | $103,900 |
| 2024 | $3,854 | $143,200 | $39,300 | $103,900 |
| 2023 | $3,603 | $143,200 | $39,300 | $103,900 |
| 2022 | $3,576 | $143,200 | $39,300 | $103,900 |
| 2021 | $3,494 | $143,200 | $39,300 | $103,900 |
| 2020 | $3,121 | $143,200 | $39,300 | $103,900 |
| 2019 | $1,093 | $143,200 | $39,300 | $103,900 |
| 2018 | $3,111 | $143,200 | $39,300 | $103,900 |
| 2017 | $2,868 | $143,200 | $39,300 | $103,900 |
| 2016 | $4,006 | $281,300 | $39,300 | $242,000 |
| 2015 | -- | $281,300 | $39,300 | $242,000 |
| 2014 | -- | $281,300 | $39,300 | $242,000 |
Source: Public Records
Map
Nearby Homes
- 321 E Carleton Ave
- 347 Muir Ave
- 528 Samuels Ave
- 155 Dietrich Ave
- 701 Muir Ave
- 193 S Cedar St
- 220 E Birch St
- 155 Coxe St
- 26 N Tahkox Dr
- Lot 46 Mountain Laurel Dr
- 14 Nicole Ln
- 96 Lehigh St
- 436 E Chestnut St
- 137 W Birch St
- 132 E Chestnut St
- 113 Johns Ave
- 1522 Terrace Blvd
- 90 N Cedar St
- 52 N Laurel St
- 56 N Laurel St