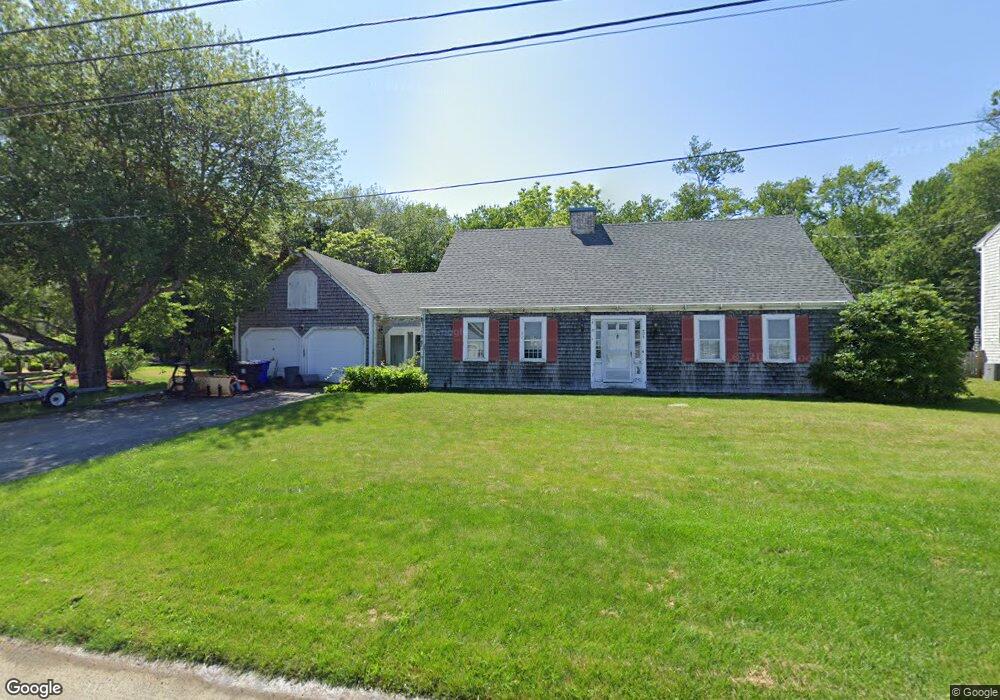
409 Seaview Ave Warren, RI 02885
East Warren NeighborhoodEstimated Value: $735,955 - $930,000
5
Beds
3
Baths
2,276
Sq Ft
$363/Sq Ft
Est. Value
About This Home
This home is located at 409 Seaview Ave, Warren, RI 02885 and is currently estimated at $825,989, approximately $362 per square foot. 409 Seaview Ave is a home located in Bristol County with nearby schools including Mt. Hope High School.
Ownership History
Date
Name
Owned For
Owner Type
Purchase Details
Closed on
Jun 23, 2022
Sold by
Andersen Edith W
Bought by
Andersen-Smith Kristen and Andersen Kurt W
Current Estimated Value
Purchase Details
Closed on
Jun 22, 2022
Sold by
Harry Andersen T
Bought by
Andersen Edith W
Purchase Details
Closed on
Jul 23, 1997
Sold by
Anderson Harry
Bought by
Anderson Kurt W and Anderson Patricia
Purchase Details
Closed on
Jun 4, 1996
Sold by
Andersen Tr Harry
Bought by
Andersen Kim E
Home Financials for this Owner
Home Financials are based on the most recent Mortgage that was taken out on this home.
Original Mortgage
$100,000
Interest Rate
7.91%
Create a Home Valuation Report for This Property
The Home Valuation Report is an in-depth analysis detailing your home's value as well as a comparison with similar homes in the area
Home Values in the Area
Average Home Value in this Area
Purchase History
| Date | Buyer | Sale Price | Title Company |
|---|---|---|---|
| Andersen-Smith Kristen | -- | None Available | |
| Andersen Edith W | -- | None Available | |
| Anderson Kurt W | $50,000 | -- | |
| Andersen Kim E | $175,000 | -- |
Source: Public Records
Mortgage History
| Date | Status | Borrower | Loan Amount |
|---|---|---|---|
| Previous Owner | Andersen Kim E | $50,000 | |
| Previous Owner | Andersen Kim E | $18,000 | |
| Previous Owner | Andersen Kim E | $100,000 | |
| Previous Owner | Andersen Kim E | $100,000 |
Source: Public Records
Tax History
| Year | Tax Paid | Tax Assessment Tax Assessment Total Assessment is a certain percentage of the fair market value that is determined by local assessors to be the total taxable value of land and additions on the property. | Land | Improvement |
|---|---|---|---|---|
| 2025 | $8,035 | $539,600 | $250,500 | $289,100 |
| 2024 | $7,792 | $539,600 | $250,500 | $289,100 |
| 2023 | $7,371 | $539,600 | $250,500 | $289,100 |
| 2022 | $8,159 | $453,000 | $239,600 | $213,400 |
| 2021 | $8,027 | $453,000 | $239,600 | $213,400 |
| 2020 | $7,864 | $453,000 | $239,600 | $213,400 |
| 2019 | $6,574 | $344,000 | $145,100 | $198,900 |
| 2018 | $6,488 | $344,000 | $145,100 | $198,900 |
| 2017 | $6,471 | $344,000 | $145,100 | $198,900 |
| 2016 | $6,582 | $329,600 | $143,100 | $186,500 |
| 2015 | $6,582 | $329,600 | $143,100 | $186,500 |
| 2014 | $6,615 | $329,600 | $143,100 | $186,500 |
Source: Public Records
Map
Nearby Homes
- 110 Seaview Ave
- 95 Winslow Way
- 15 Seaview Ave
- 285 Winslow Way
- 9 Windward Way
- 502 Ocean Grove Ave
- 0 Barton Ave
- 86 Ocean View Ave
- 72 Ocean View Ave
- 1366 Gardners Neck Rd
- 22 Harrison St
- 123 Puffer Ave
- 25 Inverness Rd
- 98 Cliff Ave
- 723 Wilbur Ave
- 7 Hawthorne Ave
- 475 Cedar Ave
- 64 King Philip Ave
- 87 Shore Ave
- 100 Evergreen Dr
- 415 Seaview Ave
- 405 Seaview Ave
- 410 Seaview Ave
- 412 Seaview Ave
- 408 Seaview Ave
- 404 Seaview Ave
- 397 Seaview Ave
- 397 Seaview Ave
- 396 Seaview Ave
- 418 Seaview Ave
- 388 Seaview Ave
- 420 Seaview Ave
- 379 Seaview Ave
- 374 Seaview Ave
- 361 Seaview Ave
- 366 Seaview Ave
- 425 Seaview Ave
- 426 Seaview Ave
- 351 Seaview Ave
- 428 Seaview Ave
Your Personal Tour Guide
Ask me questions while you tour the home.