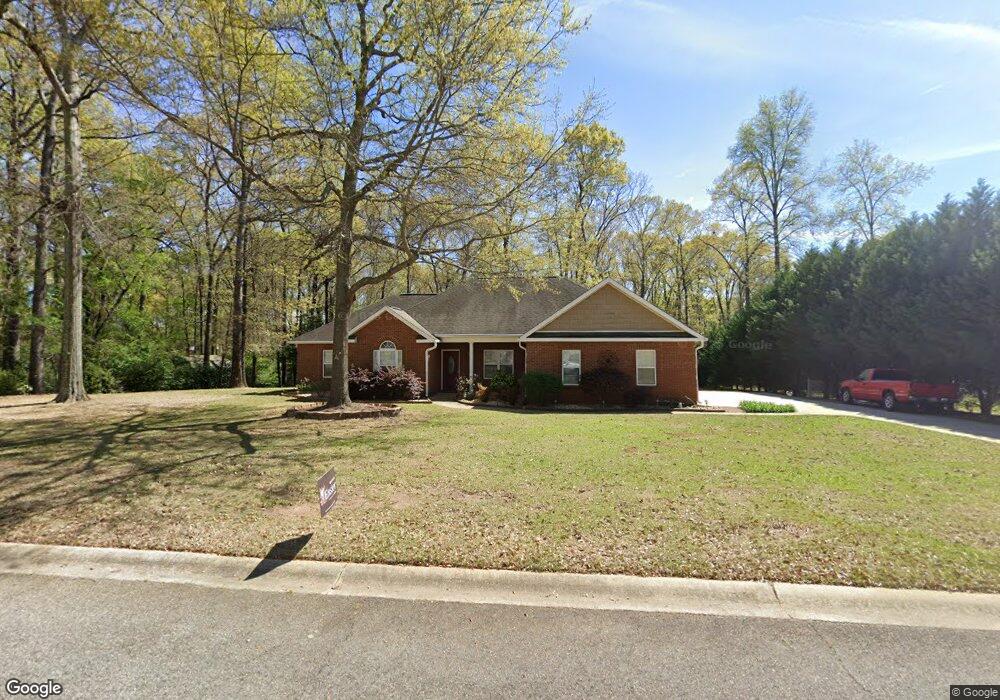
409 Sleepy Ln Warner Robins, GA 31088
Estimated Value: $286,180 - $331,000
3
Beds
2
Baths
2,119
Sq Ft
$145/Sq Ft
Est. Value
About This Home
This home is located at 409 Sleepy Ln, Warner Robins, GA 31088 and is currently estimated at $307,545, approximately $145 per square foot. 409 Sleepy Ln is a home located in Houston County with nearby schools including Lake Joy Primary School, Lake Joy Elementary School, and Mossy Creek Middle School.
Ownership History
Date
Name
Owned For
Owner Type
Purchase Details
Closed on
Oct 5, 2010
Sold by
Tanner James M and Tanner Lisa
Bought by
Tanner James M and Tanner Lisa M
Current Estimated Value
Home Financials for this Owner
Home Financials are based on the most recent Mortgage that was taken out on this home.
Original Mortgage
$52,586
Interest Rate
4.42%
Mortgage Type
New Conventional
Purchase Details
Closed on
Oct 2, 2003
Sold by
Wessex Homes Llc
Bought by
Tanner James M and Tanner Lisa*
Purchase Details
Closed on
May 1, 2003
Sold by
Pioneer Holdings & Development Inc
Bought by
Wessex Homes Llc
Create a Home Valuation Report for This Property
The Home Valuation Report is an in-depth analysis detailing your home's value as well as a comparison with similar homes in the area
Home Values in the Area
Average Home Value in this Area
Purchase History
| Date | Buyer | Sale Price | Title Company |
|---|---|---|---|
| Tanner James M | -- | None Available | |
| Tanner James M | $155,200 | -- | |
| Wessex Homes Llc | $20,000 | -- |
Source: Public Records
Mortgage History
| Date | Status | Borrower | Loan Amount |
|---|---|---|---|
| Closed | Tanner James M | $52,586 |
Source: Public Records
Tax History Compared to Growth
Tax History
| Year | Tax Paid | Tax Assessment Tax Assessment Total Assessment is a certain percentage of the fair market value that is determined by local assessors to be the total taxable value of land and additions on the property. | Land | Improvement |
|---|---|---|---|---|
| 2024 | $1,974 | $91,640 | $10,800 | $80,840 |
| 2023 | $1,798 | $83,480 | $10,800 | $72,680 |
| 2022 | $1,753 | $81,600 | $10,800 | $70,800 |
| 2021 | $1,542 | $72,560 | $10,800 | $61,760 |
| 2020 | $1,460 | $68,920 | $8,400 | $60,520 |
| 2019 | $1,633 | $68,920 | $8,400 | $60,520 |
| 2018 | $1,633 | $68,920 | $8,400 | $60,520 |
| 2017 | $1,635 | $68,920 | $8,400 | $60,520 |
| 2016 | $1,573 | $66,280 | $8,400 | $57,880 |
| 2015 | $1,558 | $65,560 | $8,400 | $57,160 |
| 2014 | -- | $65,560 | $8,400 | $57,160 |
| 2013 | -- | $65,560 | $8,400 | $57,160 |
Source: Public Records
Map
Nearby Homes
- 411 Sleepy Ln
- 407 Sleepy Ln
- 407 Sleepy Ln Unit 9
- 104 Hollow Ct
- 410 Sleepy Ln
- 408 Sleepy Ln
- 412 Sleepy Ln
- 100 Hollow Ct
- 406 Sleepy Ln
- 414 Sleepy Ln
- 228 Santa fe Trail
- 224 Santa fe Trail
- 102 Hollow Ct
- 416 Sleepy Ln
- 405B Sleepy Ln
- 405 Sleepy Ln
- 404 Yuma Ct
- 404 Sleepy Ln
- 222 Santa fe Trail
- 231 Santa fe Trail