409 Sunrise Ct Unit & Slip 7 Emerald Isle, NC 28594
Estimated Value: $1,554,000 - $2,069,000
3
Beds
4
Baths
3,091
Sq Ft
$582/Sq Ft
Est. Value
About This Home
This home is located at 409 Sunrise Ct Unit & Slip 7, Emerald Isle, NC 28594 and is currently estimated at $1,800,333, approximately $582 per square foot. 409 Sunrise Ct Unit & Slip 7 is a home located in Carteret County with nearby schools including White Oak Elementary School, Broad Creek Middle School, and Croatan High School.
Ownership History
Date
Name
Owned For
Owner Type
Purchase Details
Closed on
Jun 23, 2017
Sold by
Sylvester Nathaniel and Sylvester Emily
Bought by
Sylvester Nathaniel and Sylvester Emily
Current Estimated Value
Home Financials for this Owner
Home Financials are based on the most recent Mortgage that was taken out on this home.
Original Mortgage
$256,800
Outstanding Balance
$213,779
Interest Rate
4.05%
Mortgage Type
Future Advance Clause Open End Mortgage
Estimated Equity
$1,586,554
Purchase Details
Closed on
Apr 1, 2017
Sold by
Cochran Peter F and Cochran Suzanne W
Bought by
Sylvester Nathaniel and Sylvester Emily
Purchase Details
Closed on
Jan 8, 2013
Sold by
Pnc Bank National Association
Bought by
Cochran Peter F and Cochran Suzanne W
Purchase Details
Closed on
Jun 19, 2012
Sold by
Guthrie Randy and Guthrie Sharon Kay
Bought by
Pnc Bank National Association
Create a Home Valuation Report for This Property
The Home Valuation Report is an in-depth analysis detailing your home's value as well as a comparison with similar homes in the area
Home Values in the Area
Average Home Value in this Area
Purchase History
| Date | Buyer | Sale Price | Title Company |
|---|---|---|---|
| Sylvester Nathaniel | -- | None Available | |
| Sylvester Nathaniel | $275,000 | None Available | |
| Cochran Peter F | $199,000 | None Available | |
| Pnc Bank National Association | $246,989 | None Available |
Source: Public Records
Mortgage History
| Date | Status | Borrower | Loan Amount |
|---|---|---|---|
| Open | Sylvester Nathaniel | $256,800 |
Source: Public Records
Tax History Compared to Growth
Tax History
| Year | Tax Paid | Tax Assessment Tax Assessment Total Assessment is a certain percentage of the fair market value that is determined by local assessors to be the total taxable value of land and additions on the property. | Land | Improvement |
|---|---|---|---|---|
| 2025 | $4,615 | $1,267,334 | $354,276 | $913,058 |
| 2024 | $4,561 | $824,437 | $267,600 | $556,837 |
| 2023 | $4,473 | $824,437 | $267,600 | $556,837 |
| 2022 | $4,371 | $824,437 | $267,600 | $556,837 |
| 2021 | $4,279 | $824,437 | $267,600 | $556,837 |
| 2020 | $4,269 | $824,437 | $267,600 | $556,837 |
| 2019 | $2,646 | $848,649 | $284,325 | $564,324 |
| 2017 | $1,011 | $670,285 | $284,325 | $385,960 |
| 2016 | $881 | $321,146 | $284,325 | $36,821 |
| 2015 | $853 | $284,325 | $284,325 | $0 |
| 2014 | $1,040 | $346,822 | $346,822 | $0 |
Source: Public Records
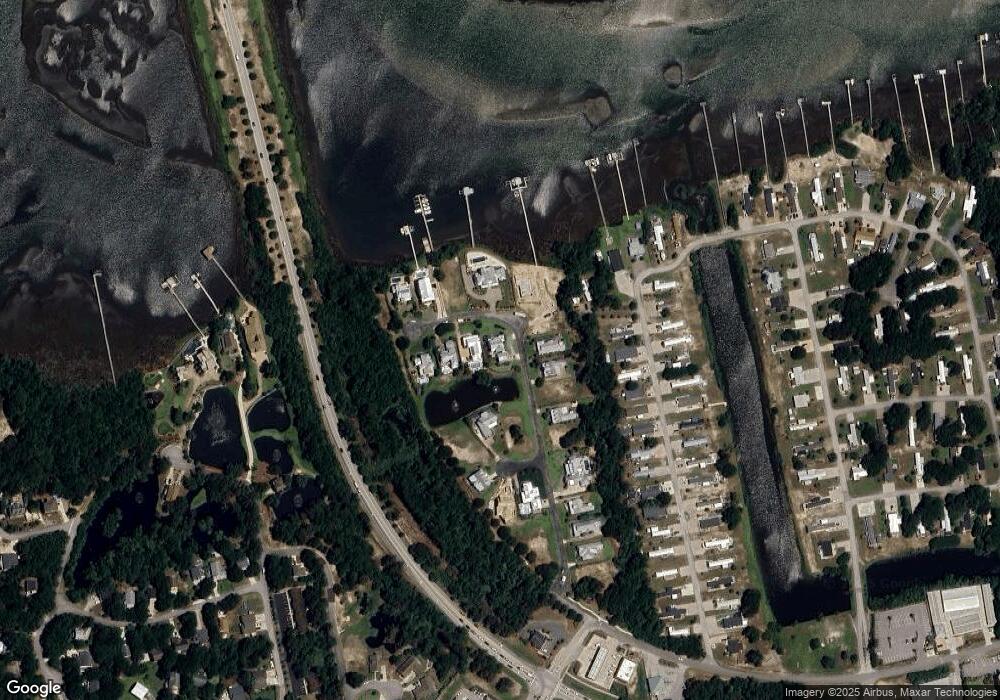
Map
Nearby Homes
- 409 Sunrise Ct
- 303 Osprey Ridge Dr
- 9260 Osprey Ridge Dr
- 8906 Edgewater Ct
- 8904 Sound View Ct
- 403 Emerald Landing Dr
- 139 Fawn Dr
- 9003 Village West Dr Unit A
- 205 Islander Dr Unit B2
- 9201 Coast Guard Rd Unit D204
- 9201 Coast Guard Rd Unit C101
- 9201 Coast Guard Rd Unit F204
- 9201 Coast Guard Rd Unit H206
- 9201 Coast Guard Rd Unit H210
- 9201 Coast Guard Rd Unit E-101
- 9201 Coast Guard Rd Unit E303
- 133 Doe Dr
- 8723 Plantation Dr
- 9100 Reed Dr Unit 4305
- 9100 Reed Dr Unit 3302
- 430 Sunrise Ct
- 413 Sunrise Ct
- 434 Sunrise Ct
- 422 Sunrise Ct
- 432 Sunrise Ct
- 428 Sunrise Ct
- 426 Sunrise Ct
- 424 Sunrise Ct
- 415 Sunrise Ct
- 436 Sunrise Ct
- 418 Sunrise Ct
- 438 Sunrise Ct
- 402 Sundown Ct
- 416 Sunrise Ct
- 404 Sundown Ct
- 412 Sunrise Ct
- 400 Sundown Ct
- 414 Sunrise Ct
- 527 Harbor Dr W
- 409 Sundown Ct